
 After years of record low volatility, falling interest rates, and no worries about inflation, 2018 appears to finally be offering us a glimpse of the future.
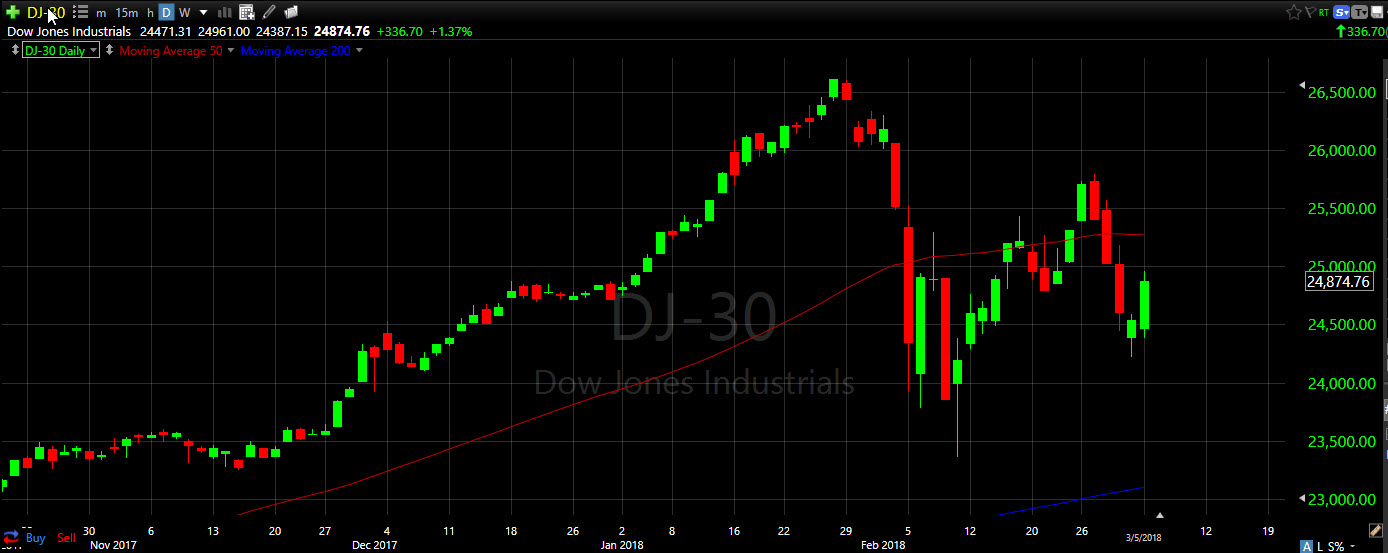
Above is a quick daily snapshot of the Dow Jones Industrial average. Time will tell if these recent tremors are just the lead up to a much bigger and overdue earthquake in the financial markets.
As a quick recap and summary, here are where things stand at the present moment;
- Extreme valuations across almost all asset classes.
- Rising inflationary pressures
- Rising interest rates at both ends of the yield curve
- Record levels of debt across all sectors; sovereign nations, municipalities, corporate, and individual.
- Record high margin debts (investors buying stocks using borrowed money).
- Unemployment that is now below what would be considered “full-employment” within the economy.
- Central Banks removing, shrinking, and ending financial stimulus that was a huge factor in the global accumulation of debt and rising asset prices that aren’t supported by underlying business fundamentals.
- Asset prices that have moved far faster than the underlying growth in revenues, earnings, and cash flows of those assets.
What we don’t know yet is if the high set at the end of January will be the “cycle peak” in the latest market run supported by massive central bank stimulus around the world.
During this first half of the investment cycle, investors around the world collectively believed that they are acting rationally and behaving prudently in the third bubble in less than 20 years. Behavioral economics is alive and well and in play right here and right now in your life.
Investors are once again saying, “This time is different,” or “This is the new normal.” Investors are once again justifying irrational behavior on a massive scale.
Investors once again chased what appears to be easy money, fast gains, and the path to financial success with little regard to mathematical truths.
Yet, it will end the same way it always ends with bubbles – painfully.
A Look Back Over 20 Years
“For those wise investors who pay attention to historical norms, we know that 1996 through 2000 was a valuation bubble, and we know that 2003 through 2007 was a debt bubble. Current valuations and debt levels are above those past recent examples. What should a rational investor think about today’s situation with a double-whammy in play?”
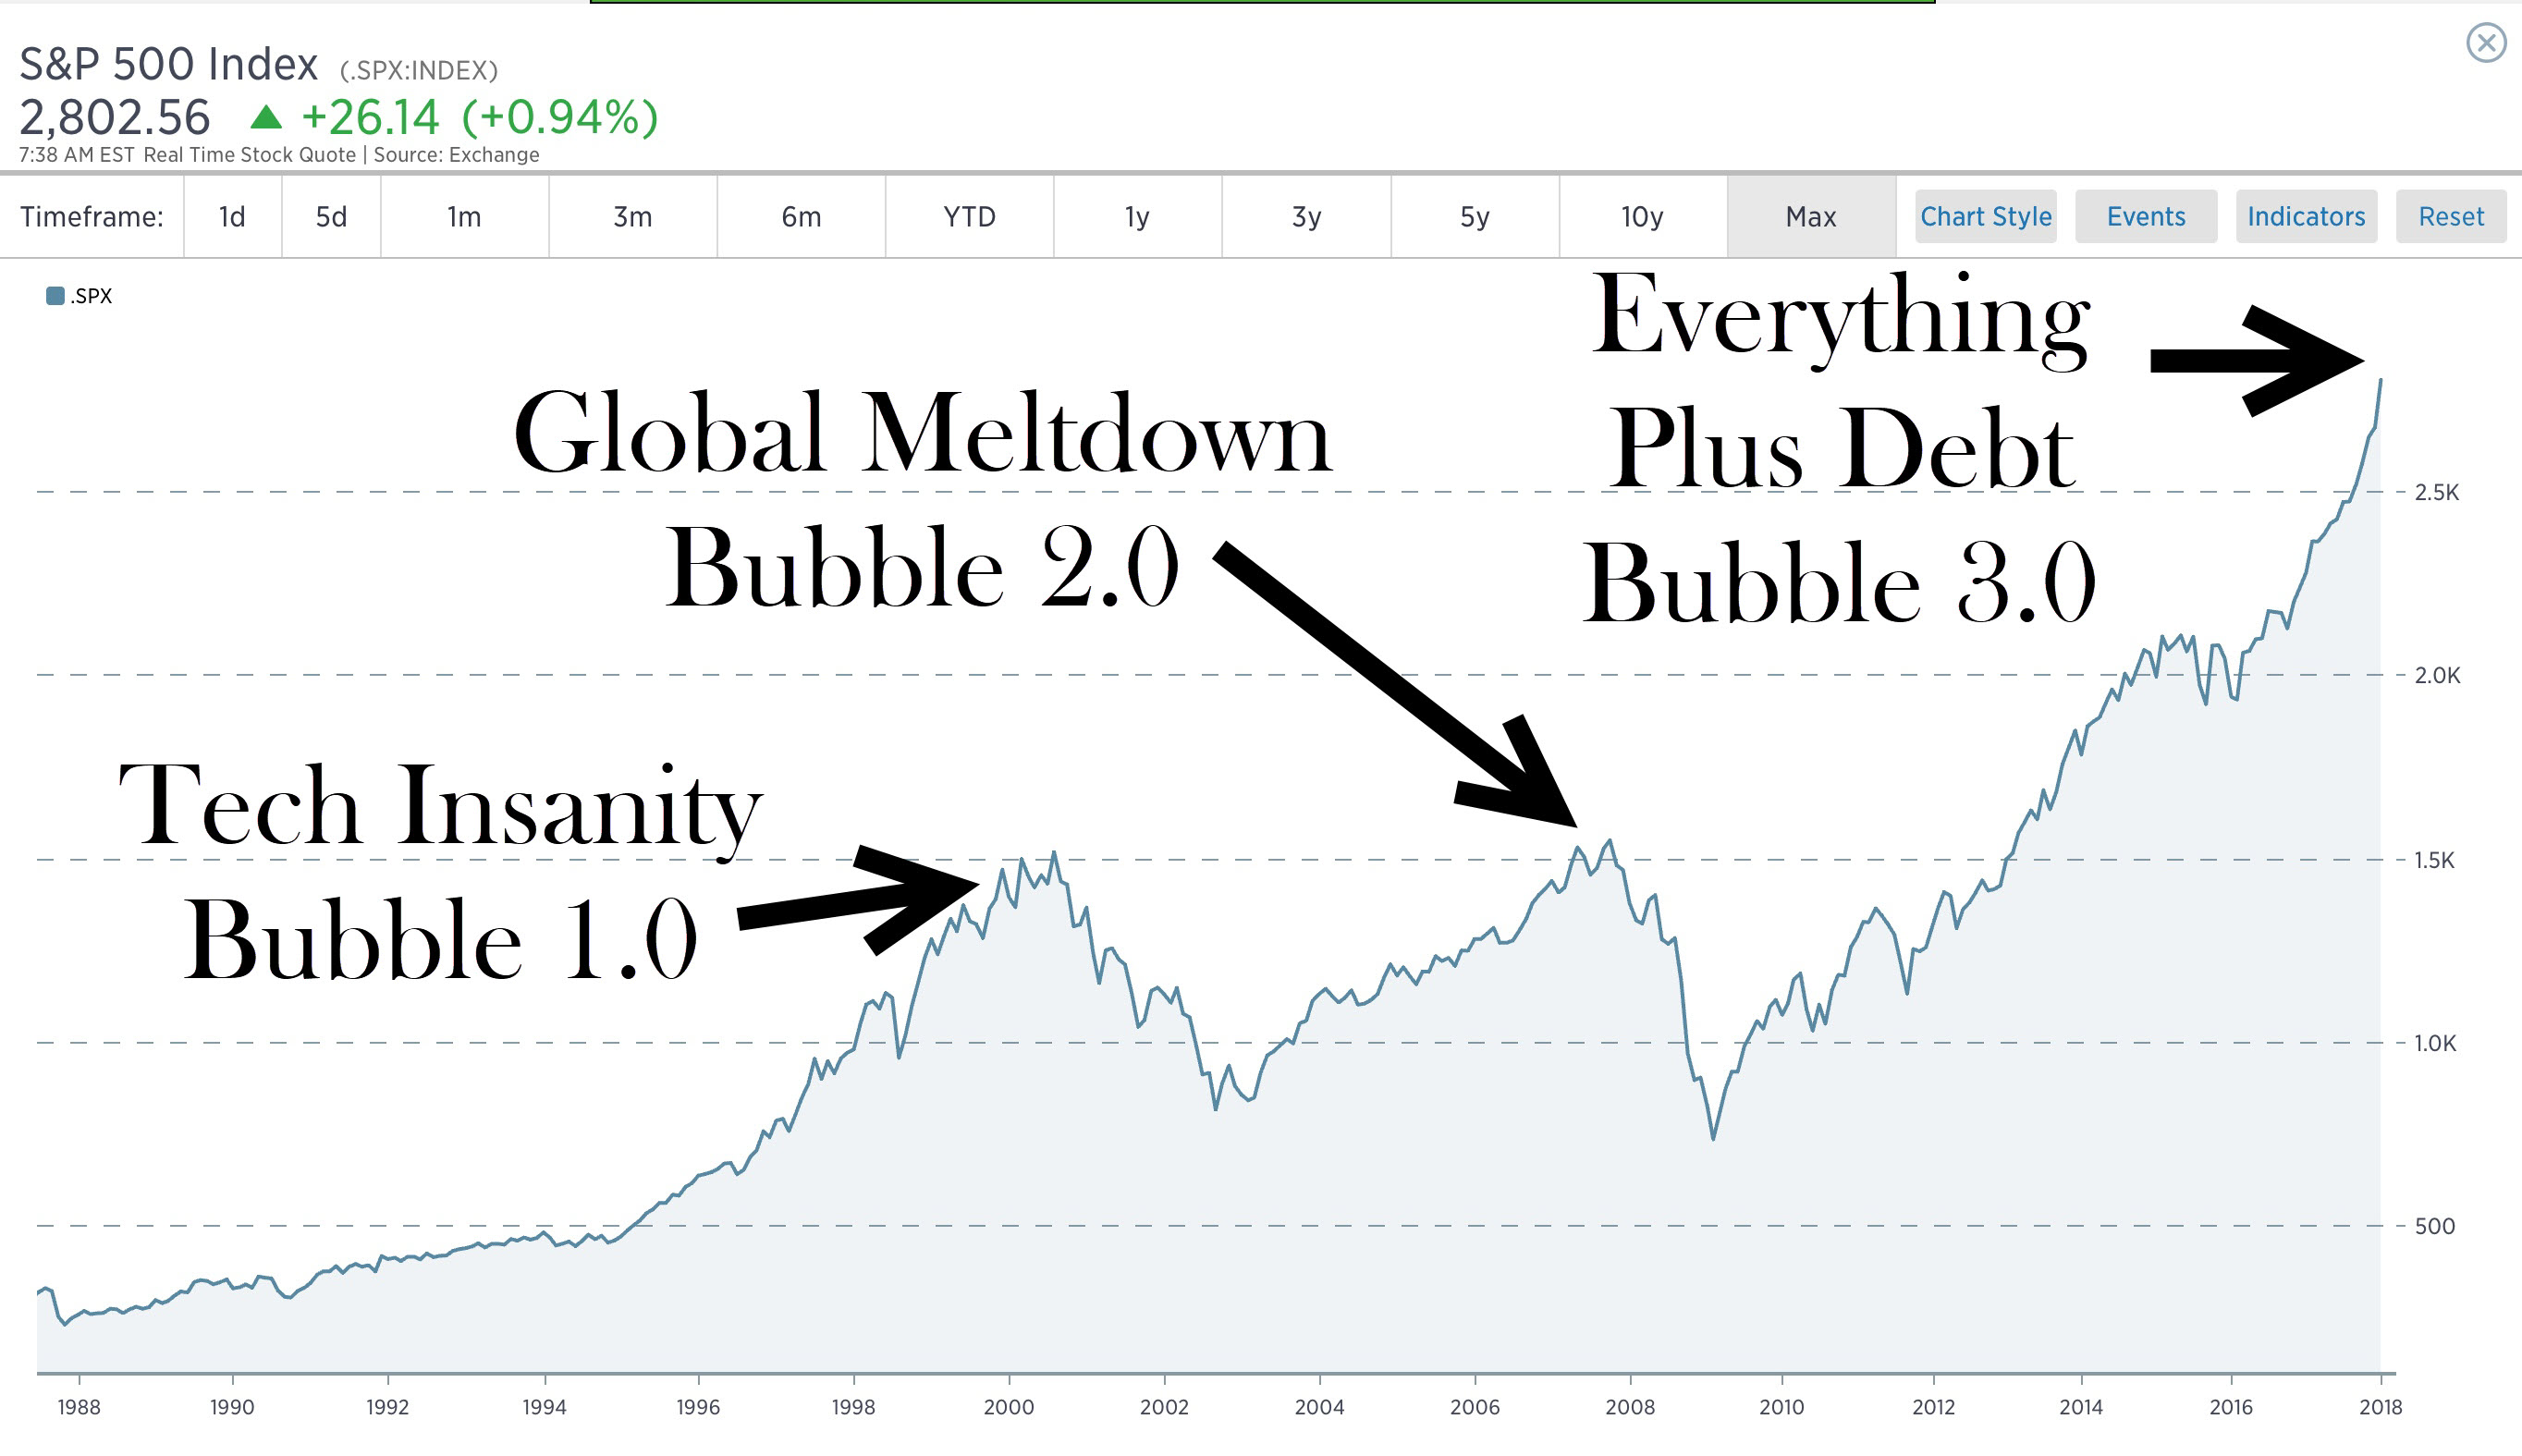
Just as a friendly public service announcement, the tech bubble led to tech stocks dropping 82% while the S&P 500 dropped over 50%. The global economic meltdown resulted in the S&P 500 dropping 57% over about 18 months while many individual stocks posted losses far greater than that. How do you really think this current bubble is going to end other than painfully just like bubbles of the past?
If you study market history and averages, then it would be important to know that the markets would have to come down about 65% just to get back to long term average valuations. Note that by the very nature of math, markets are both above average and below average for stretches of time to get to “the average.” Thus, it wouldn’t be out of the ordinary for markets to end up “below average” at some point for a stretch of time to reset back to the mathematical average. That’s just something to consider.
And if you are sitting there thinking, “There’s no way markets can come down greater than 50%!” then you are historically challenged because markets have come down more than 50% every single time they have been at extreme levels of valuation like today (1929, 1999, 2007 and throw in Japan in 1989). We are living through a lifetime event right now whether you realize that or not.
If you are thinking, “Yeah but stocks ALWAYS come back quickly,” then you are historically challenged. It took almost 25 years for the Dow to just get back to break-even after the 1929 market collapse when valuations were less extreme than they are today. The Dow Jones peaked on October 28, 1929 at 381.17 and did not hit that level again until March 5, 1954. Investors spent 24 ½ years just trying to get back to “Even-Steven.”
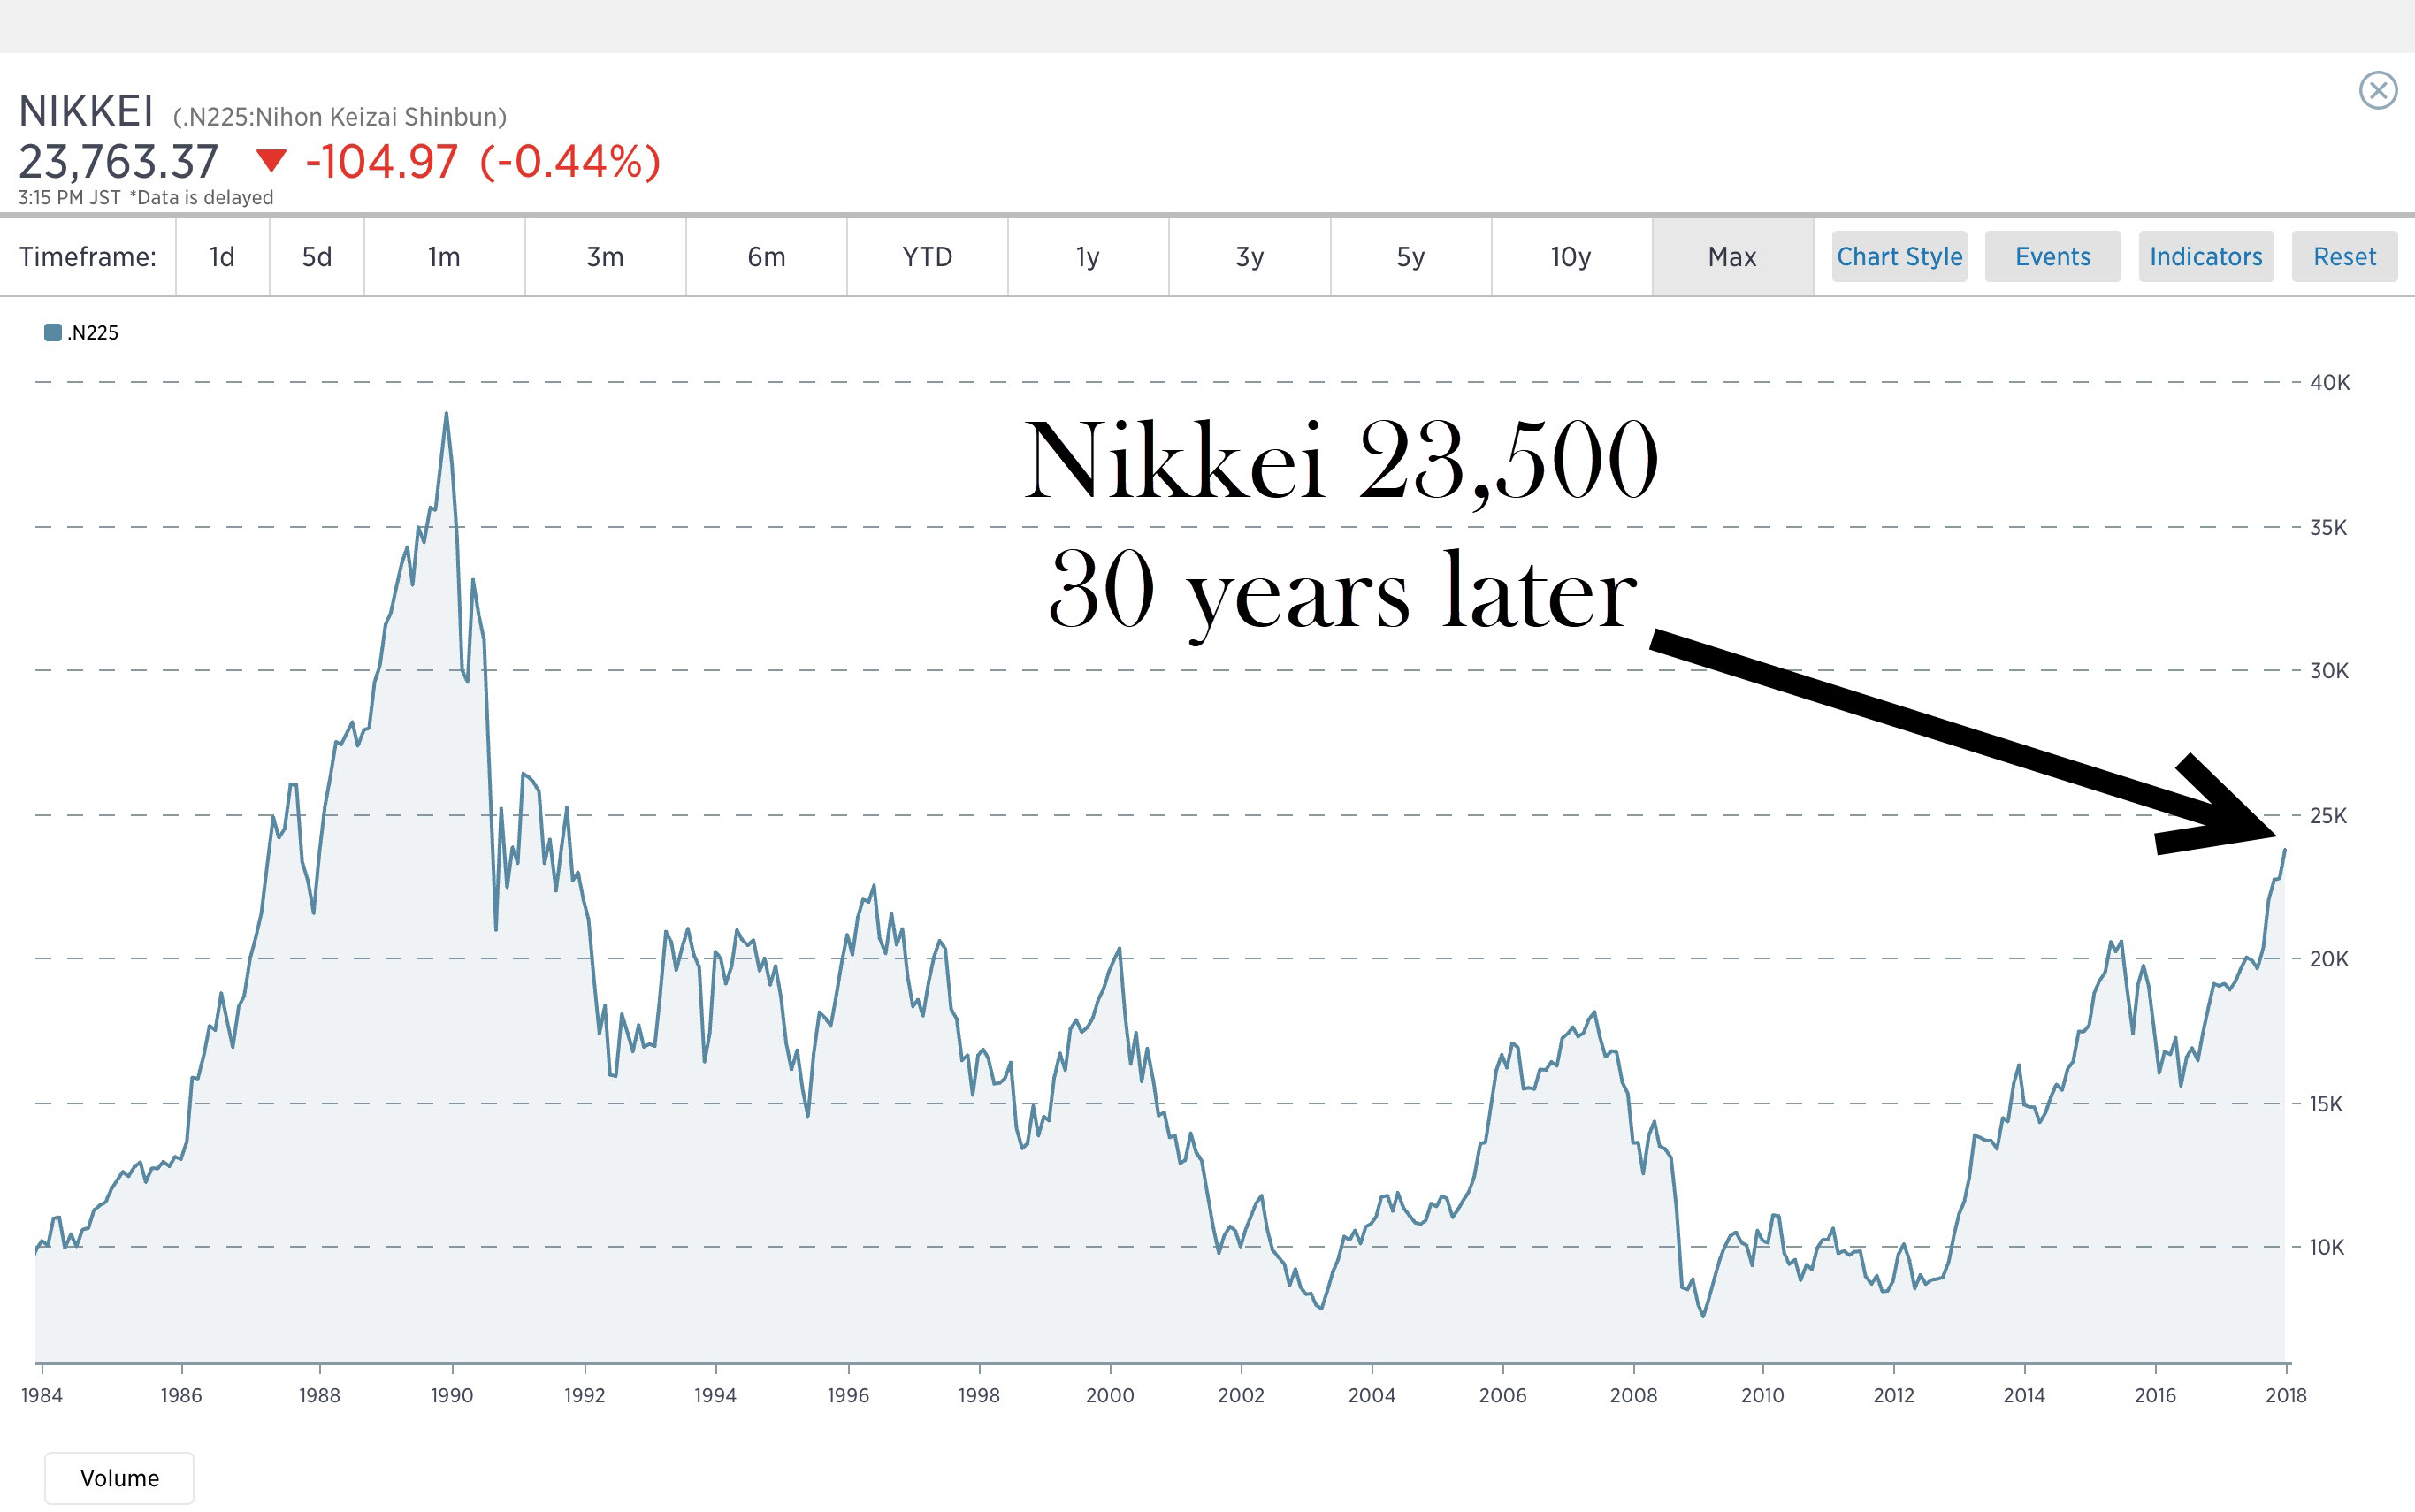
To add, Japan had an epic bubble that peaked in 1989 when the Nikkei hit 40,000. It’s almost 30 years later and the index has finally recovered to 50% of those levels last seen three decades prior. So, if you are saying, “Stocks always come back no matter how insane the valuations,” you are historically challenged.
Going Three Layers Deep On Valuations
As we recall the lessons of our past, we must acknowledge that cycles and bubbles are part of markets. Markets are made up of humans and humans are irrational beings driven by greed and fear. Markets won’t change because humans won’t change. They are what they are.
Valuations One Layer Deep – A Look At Basic Valuation Metrics
Valuation Metric #1 – Shiller P/E (also known as CAPE ratio which accounts for the normal impacts of business cycles.) Conclusion – Extreme valuations surpassing those just prior to the Great Depression.
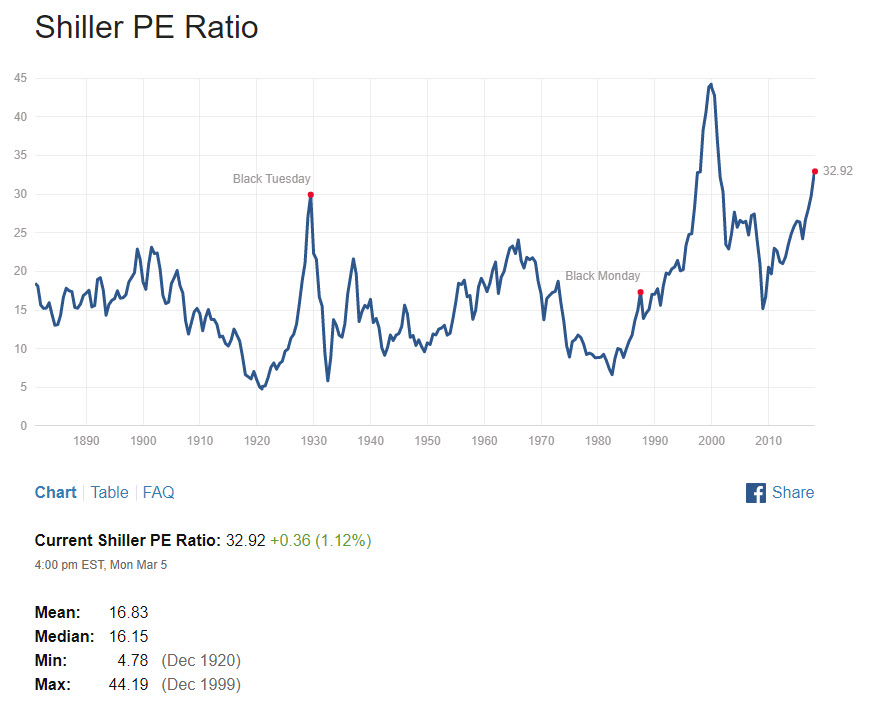
Source: Multpl.com
Valuation Metric #2 – Price to Sales Ratio of the Median Stock in the S&P 500. Conclusion – Extreme valuations that have significantly surpassed all-time highs. Investors are paying ever higher levels in stock prices for every dollar of revenue generated by corporations.
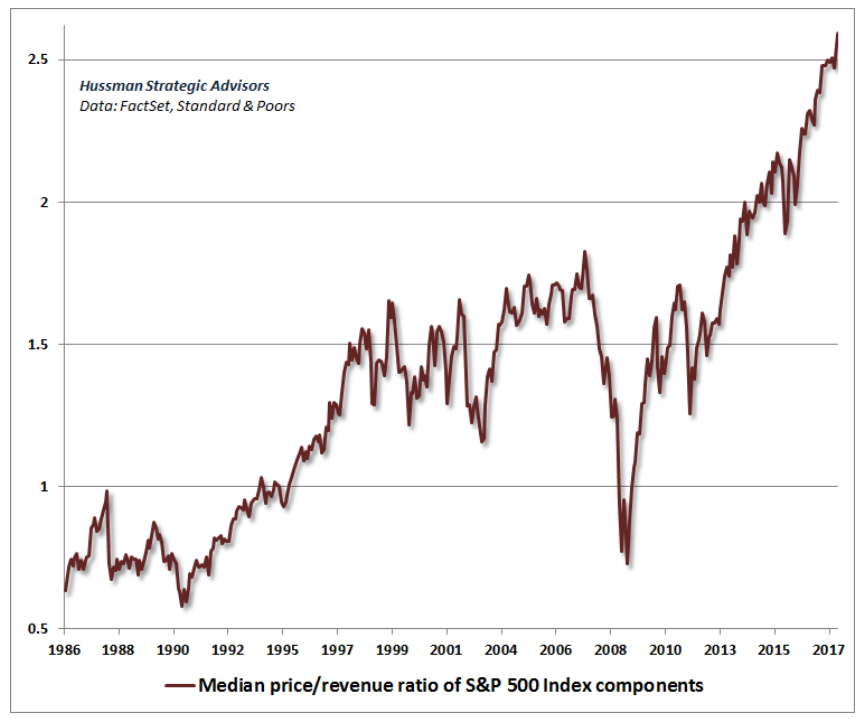
Source: Hussman Strategic Advisors
Valuations Two Layers Deep – We now look at some more sophisticated valuation metrics that provide insight into current market conditions.
Valuation Metric #3 – Buffett Indicator, Corporate Equities Market Capitalization to GDP. I normally show a market cap to GDP chart here but wanted to show another example of something that depicts just how extreme these markets have been. The below chart is what is called the “Nonfinanical market capitalization/Nonfinancial Corporate Gross-Value Added including estimated foreign revenues” chart. It has an approximately -93% accuracy correlation to subsequent 12-year S&P 500 returns (about the most accurate 12-year valuation measure there is). It is screaming “off the charts over-valued.”
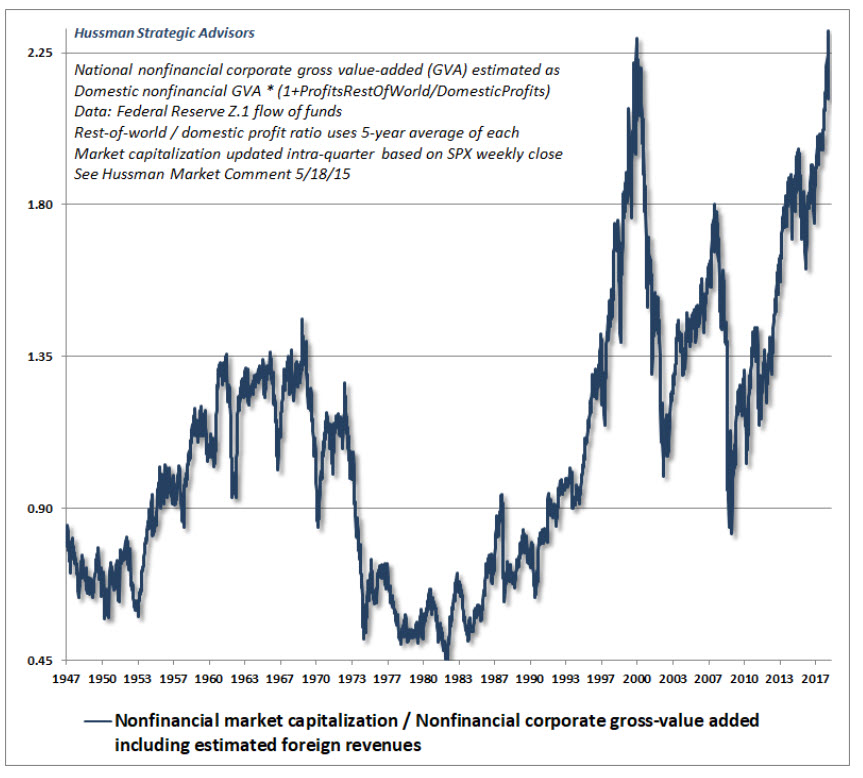
Source: Hussman Funds
Valuation Metric #4 – Q Ratio. The Q Ratio was developed by Nobel Laureate James Tobin. It is the total price of the market divided by the replacement cost of all its companies. Conclusion – Extreme valuations that have only been higher just before the crash of the tech bubble.
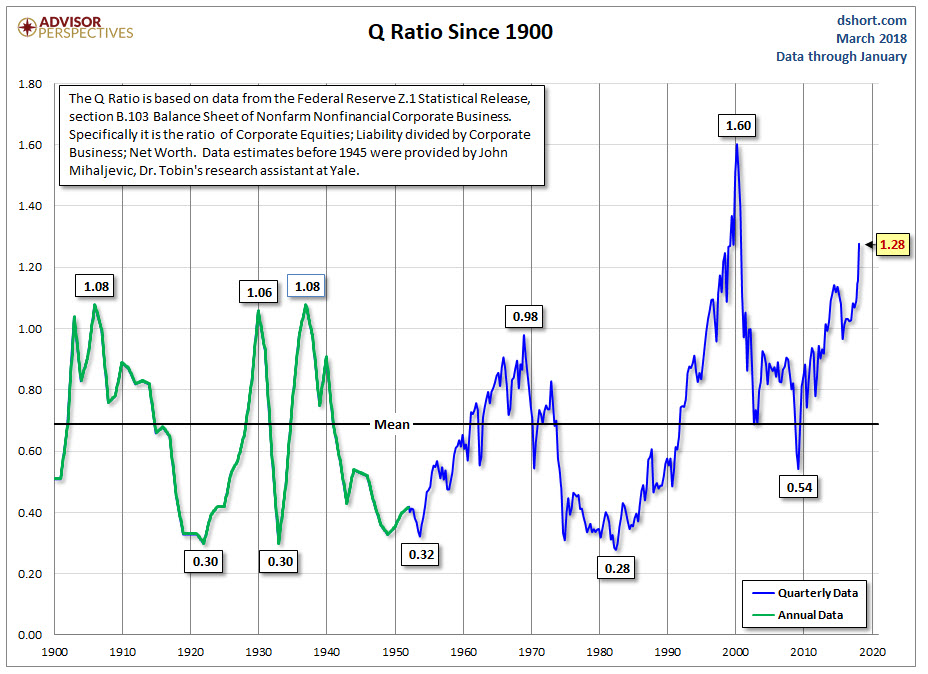
Source: Doug Short and Advisor Perspectives
Valuations Three Layers Deep – We now look at some of the most sophisticated valuation metrics that provide insight into current market conditions.
Valuation Metric #5 – S&P Regression To Trend. The idea here is that things revert back to the mean especially in the stock market and over the long-term, over-performance turns into under-performance and visa-versa. Conclusion – Extreme valuations that have only been higher just before the crash of the tech bubble and significantly higher than levels before the Great Depression and prior to the Global Economic Collapse of 2008-2009.
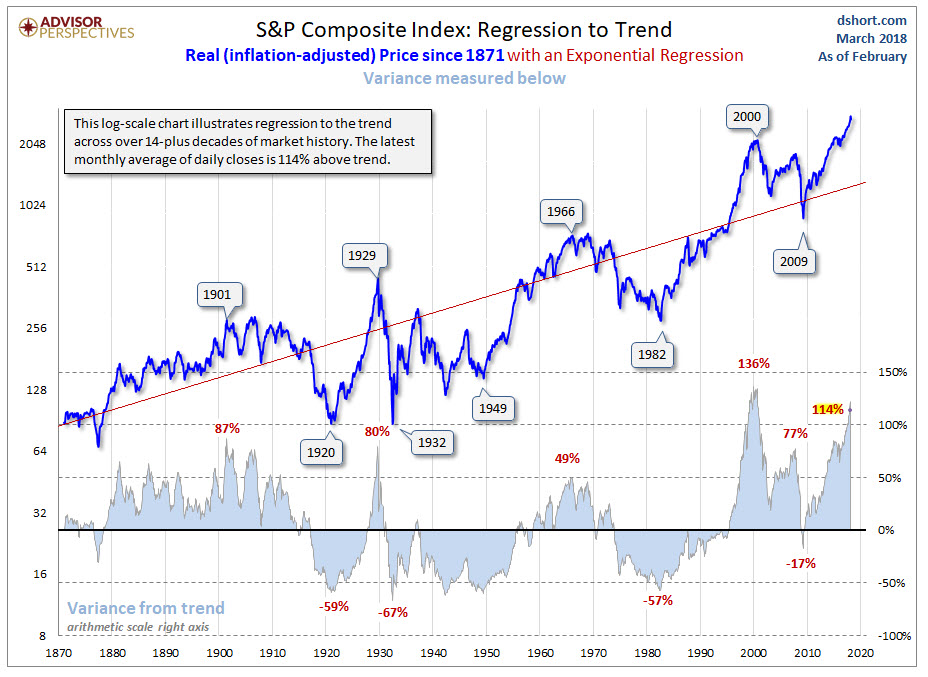
Source: Doug Short and Advisor Perspectives
Valuation Metric #6 – Market Capitalization of Non-Financial stocks/Non-financial Gross Value Added (GVA). The idea here is that long-term GDP can be reasonably predicted based on economic productivity metrics and labor forecasts based on known demographic trends. Since corporate revenues and earnings make up a fairly consistent component of overall GDP, they can also be reasonably estimated over long-term forecasts. Thus, comparing the current price levels of equities to Gross Value Added allows an investor to make assumptions on expected 12-year rate of returns based on those prices paid. Conclusion – Investors buying equities at these current levels should expect a 12-year annualized rate of return that will be negative (with large negatives along the way as prices revert to the mean between now and then). Thus, investors who are paying current prices are only subjecting themselves to extreme levels of risk with the high probability of losses until prices come down to more reasonable and profitable levels.
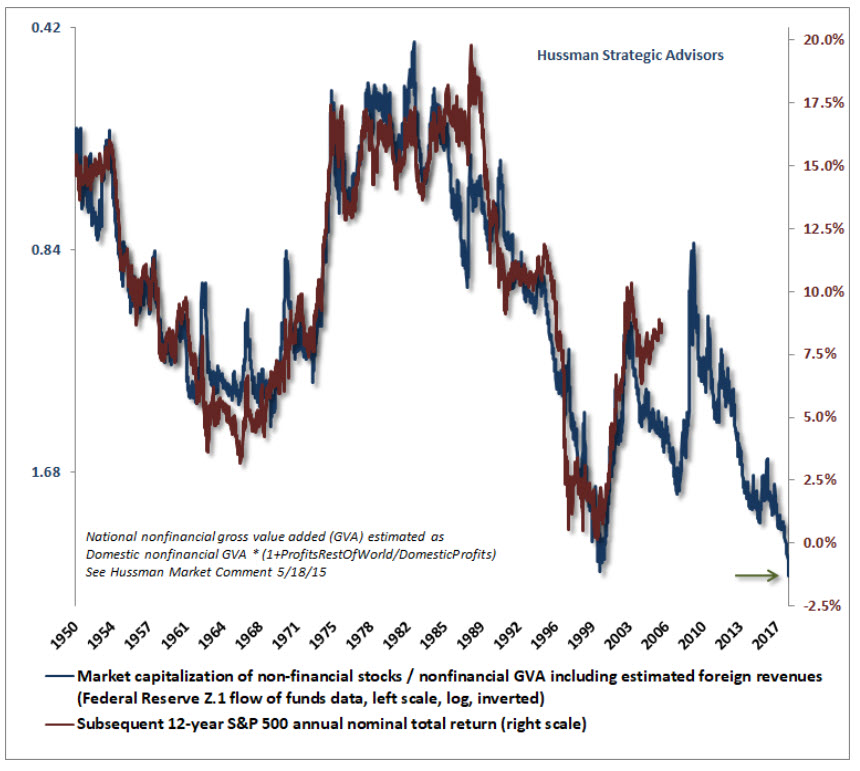
Source: Hussman Strategic Advisors
Valuation Metric #7 – Geometric Average of the Four Valuation Indicators. Using averages of four but different methods of valuation metrics can provide investors with an overview to ensure that they aren’t just paying attention to one single outlier metric that may not accurately reflect current valuations. Conclusion – Full on bonkers. Buyer beware.
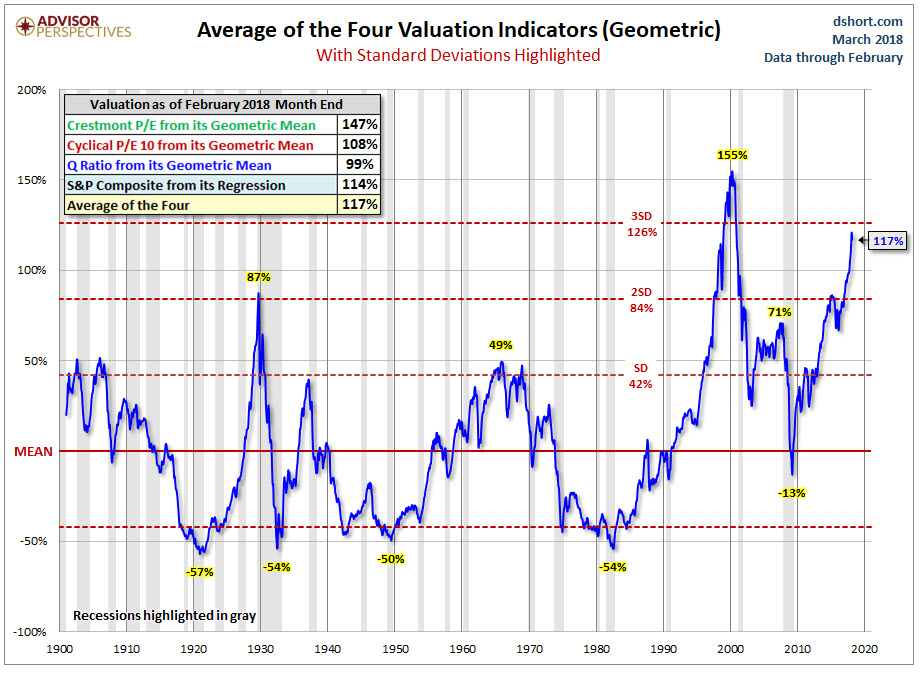
Source: Doug Short and Advisor Perspectives
Corporate Earnings Shenanigans
We have one last item to be very skeptical of coming from Wall Street. Wall Street loves to tout the growth of earnings as a reason for the ever-increasing levels of stock prices. They have very good reason to do that as they want to keep investors in the game paying higher and higher prices for their offerings so that they can continue to collect their fees and commissions.
But most investors don’t know that corporations report two different sets of books and numbers. The first set of books (and most highlighted and publicized by the media and Wall Street) is what is called “operating earnings.”
Operating earnings is what Wall Street wants us to focus on. It is the level of earnings that corporations make from what they describe as the “normal course of business.” But something isn’t right in fantasy-land. If we look at the chart below, we can see that the growth in operating earnings since 2011 has been up 29.6% yet stock prices have gone up almost 3 ½ times those levels. Should you be skeptical? Yes, you should be. Stock prices can’t deviate from earnings indefinitely. Eventually they must reconcile and correlate.
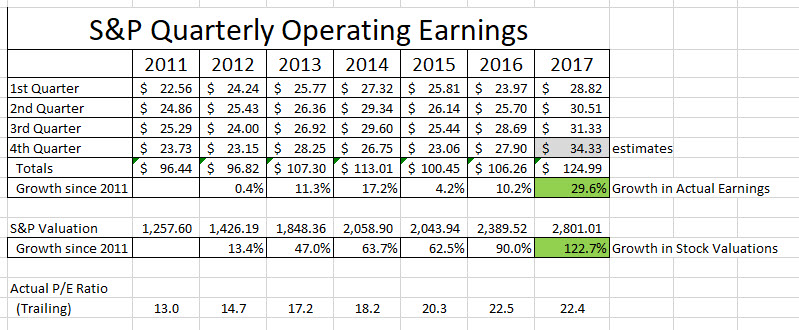
Source: Standard & Poors and Paul Kindzia
What this is indicating is that investors have been paying higher and higher levels for the underlying stocks and earnings.
The Second Set Of Books
What most investors don’t realize is that these same publicly traded companies must report earnings to the SEC based on Generally Accepted Accounting Principles that are audited by CPA firms. This second set of books produces what is called, “As Reported Earnings.”
What’s the difference between the two sets of numbers? There is a big difference. With the first set of books, corporations can report earnings from what they consider, “The normal course of business.” That means what they would expect their business to produce in normal and consistent ways. This allows them to ignore actual expenditures, costs and expenses related to what corporations would describe as “One-time events” or “Unusual Items.”
This is where the magic of fictional accounting enters the scene. I want you to imagine that a corporation acquires another organization to boost their earnings per share. If the acquisition turns out to be a big flop and lost money, corporations can write-off the losses and ignore those losses in “operating earnings” and claim it as a “one-time unusual event.” Voila! The losses are excluded from operating earnings which are used by Wall Street to promote stocks to investors who don’t know any better.
There are all kinds of examples of how corporations exclude real losses from operating earnings by doing accounting tricks. But SEC rules mandate that all publicly traded companies also report, “As Reported Earnings.” Consider these earnings to be “the real deal earnings” without all the tricks, smoke and mirrors.
As reported earnings have to include all of the corporate blunders and true costs of operating the business. Below are the “As Reported” earnings over the same 2011 – 2017 time period.
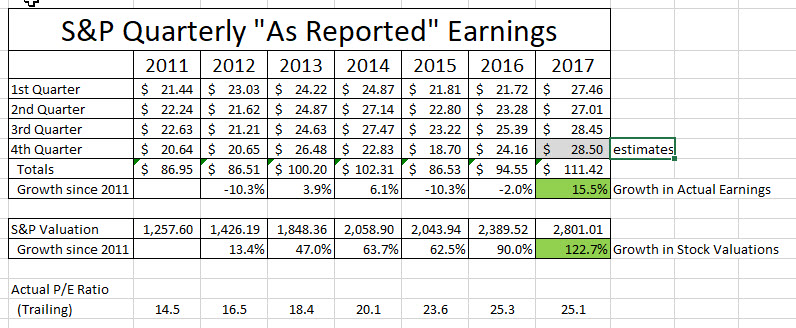
Source: Standard & Poors and Paul Kindzia
Now the discrepancy is even larger. We have actual “As Reported” earnings that have only grown 15.5% over the past six years yet the prices of stocks have gone up 122.7%. Buyer beware. Investors are being fooled and being sucked into the bubble due to greed and the dream of easy money.
Conclusion: Markets have been and continue to be at extreme levels of valuations that based on past history will end very badly for investors buying at these price levels.
Add in the additional factors that are distorting the books of companies such as borrowing money to buy back shares (decreasing the float), tax inversions, re-financing debt or issuing large amounts of debt that must be dealt with down the road and you have a recipe for an eventual day of reckoning.
How To Make Money and Build Wealth In Financial Bubbles Safely
Building wealth requires one to see the similarities from financial history and what happens when you get into valuation bubbles and debt bubbles. This allows you to avoid those eventual losses on the back end of the cycle.
Building wealth during bubbles means keeping your personal debt levels low or better yet – getting your household debt free. Avoid the financial imprisonment that millions of others are experiencing often with life sentences.
Building wealth means doing very basic things; making a strong income from personal productivity, living below your means, building emergency funds, paying off debt, and avoiding bad investment risks by investing wisely FOR THE LONG TERM.
The rewards will be had on the other side of the mountain when prices reset and the debt bubble collapses.
“The one thing we really learn from history is that humans usually completely ignore history.”
The Dangers of Buying And Holding During High Valuations
If you are an investor who is buying or holding large amounts of equities during times of extreme market valuations, you are basically saying that price does not matter at all in investing. But what you should know is that eventually PRICE ALWAYS MATTERS.
Now a comment that is made very often by investors is, “But if I am too conservative for a period of time during market extremes and generate a low return, I can’t/won’t meet my goals. Plus, everybody else is making easy money while I’m missing out.” But this mindset is assuming that markets will stay at extreme valuations forever and ever.
The question you need to ask yourself is this; “If you don’t think you will reach your goals while temporarily earning a low rate of return to protect yourself during market extremes, how do you really believe you will reach your long-term goals if you watch your capital base diminish 40%, 50%, 60% or more?”
We have only been in extreme conditions like this a handful of times in market history and they all ended terribly with very large investor losses for those taking on that investment risk. Ask yourself what would happen to your retirement plans if you lost 50% or even more than 70% of your capital base?
Could you hang on and recover from such a loss?
The value of having a trusted advisor on your side is that they can help guide you through these times. We are here to help you navigate what should be very challenging market conditions during the second half of the market cycle. And here is the good news…For those wise investors who pay attention to price and value and protect their capital during bouts of extreme valuations, they are best positioned to take advantage of lower prices and better values once market conditions reset to historical norms.
The key to successful investing is to buy quality investments at fair prices (or better yet – attractive prices.) If the price isn’t right, you should have the fortitude, discipline, and patience to simply not buy and wait for better prices to come along in the future.
What would it feel like to boost your wealth significantly over the coming decade? Avoiding high-risk investment conditions is one of the best tactics and strategies available to make that happen.
For additional specific resources related to the current financial bubble, feel free to access these archived resources on my website and blog;
- January 19, 2018 – https://paulkindzia.com/why-you-dont-want-to-be-a-star-in-a-future-michael-lewis-blockbuster-film/
- November 9, 2017 – https://paulkindzia.com/what-you-can-learn-about-investing-from-one-of-the-greatest-human-minds-of-all-time/
- September 29, 2017 – https://paulkindzia.com/be-ready-for-anything-but-especially-opportunities/
- June 25, 2017 – https://paulkindzia.com/investors-are-vacationing-in-finance-fantasy-land-again/
- May 12, 2017 – https://paulkindzia.com/wall-street-untruths-and-bad-math/
- April 12, 2017 – https://paulkindzia.com/poker-patsies-investing/