
Part I – Betting On Forever
Do you remember any of those past periods or cycles in your life when everything was wonderful and dreamy? Maybe it was those times where you were riding the school bus to high school, and you were sitting next to your little sweetie, holding hands, sharing stories, and relishing in the day. You would look into their eyes, and they would look into your eyes, and your little hearts would go pitter-patter as your palms got sweaty.
What made those times so memorable is because, at the moment, you believed that those times would last forever. You wanted them to last forever. You couldn’t even imagine anything different
Forget the fact that you never sat back and asked yourself if you believed it to be reasonable that you would ride a school bus for the rest of your life. Or that you would still be living in your parent’s house on that school bus route in twenty years. That entire block of time, as lovely as it appeared, was just a phase of life. It was just part of the school cycle.
Nothing was permanent unless we explicitly talked about the initials you carved in a tree with the shape of a heart in-between. The rest wasn’t forever. You just thought it would be forever because of recency bias, which is just a fancy way of saying that humans have psychological behaviors programmed into them to make them believe that whatever is happening right now will continue forever. Don’t worry. If you didn’t have a recency bias, you wouldn’t be a human.
Recency bias is a cognitive bias that favors recent events over historical ones. It could apply to many areas of life, but it is crucial in investing and financial planning. To quote Wikipedia;
“With recency bias, people tend to put too much emphasis on recent events. This bias may lead investors to think that a current stock market downturn or rally will extend into the future. Recency bias can lead investors to make short-term decisions that deviate from their financial plans.”
It’s essential to put into context the phrase, “recent events.” Financial markets can do some pretty nutty things for periods that start to monkey with our monkey brains. The phrase, “recent events” doesn’t necessarily mean two or three weeks, two or three months, or even two or three years. Recent events in the context of historical financial markets mean, more or less, an undetermined amount of time before the masses return to reality. Recent events that cause stock market bubbles may mean six months, but they also could mean six years. We just never know until the bubble bursts.
The cruelty of cognitive biases is that they trick mortal humans into making very foolish decisions that are clearly against their long-term self-interest. These foolish decisions usually only become apparent to the masses in hindsight.
Suppose we observe the current actions and behaviors of investors in the financial markets. In that case, the overwhelming majority of investors are betting on positive factors to continue forever to justify their well-intended behaviors.
If you stop and ask investors to explain their bets, they will provide you with such factors as;
- Momentum,
- The economic reopening for post-COVID life,
- The value of groupthink on Reddit forums,
- Jim Cramer’s Mad Money picks of the week,
- Some new revolutionary technology that is just sure to become the next Tesla or Amazon,
- What they think they need to do to keep up with their neighbors,
- What they believe they have to do to reach their retirement goals.
These beliefs and behaviors on the surface are pretty rational and directed towards their self-interest. It appears to be logical.
But in reality, what they are collectively betting on are three inferior mathematical outcomes. They are betting on forever. They are betting on never. They are betting on someday.
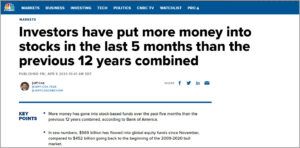
Collectively, equity investors are now all-in on stocks. Below is a powerful headline from CNBC on April 9, 2021.
 (Source: CNBC)
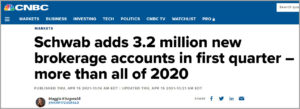
Meanwhile, brand-new investors are pouring into the markets like never before.
 (Source: CNBC)
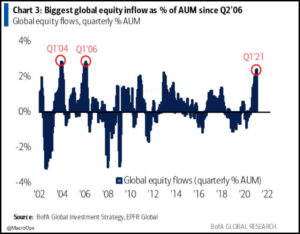
More capital flowed into global equities during the past quarter than any time since Quarter 1 of 2006, which preceded the Global Economic Meltdown in 2007.
 (Source: Bank of America Research via MacroOps)
According to Bank of America, wealthy clients boosted their equity allocations to 63.6%, the highest level on record.
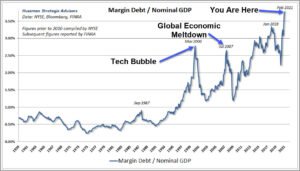
Investors use of leverage (borrowing money to buy stocks) is now more than $800 billion to further fuel their quest to chase equity markets. Investors using margin debt to leverage their stock allocations have never been higher compared to GDP.
 (Source: Hussman Strategic Advisors)
The gambling chips of investors are now aggressively stacked on the tables in front of them. Never have they been more confident in such a sure bet, so they believe. What could possibly go wrong?
Giddy Wall Street participants have declared a personal triumph. They have asserted themselves free to direct their offensive investing behaviors centered upon the following dynamics;
- Low-interest rates (or negative interest rates globally)
- Low corporate tax rates
- Low inflation
- Low labor costs relative to executive compensation
- High corporate profit margins
While these elements have been present over the past few years, what investors are betting the farm on is that these same factors will continue forever.
Interest Rates
Investors have enjoyed a double whammy of a long-term trend of falling interest rates AND sub 3% 10-Year Treasury rates (with short-term Treasury notes near zero) for the last few years. Looking back on the previous 150 years of data, is it prudent to bet that these record low rates will continue forever?
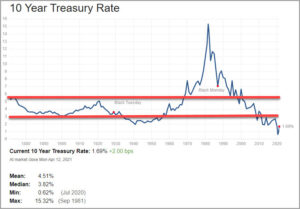 (Source: multpl.com)
Investors are betting that short term interest rates will effectively stay at 0% (or negative around the rest of the world) forever;
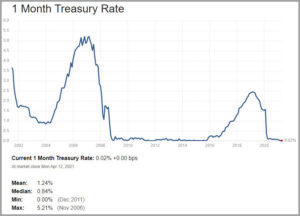 (Source: multpl.com)
Federal Corporate Tax Rates
Investors are betting that federal corporate tax rates will stay this low forever while the United States budget deficit continues to run at record levels that are now over a trillion dollars annually;
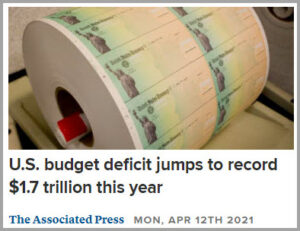
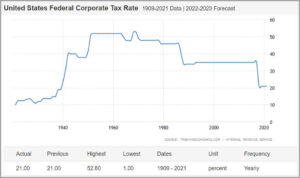 (Source: Trading Economics)
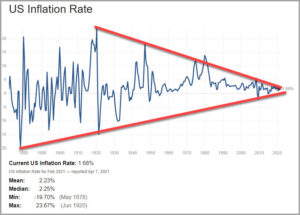
Inflation Rate
Investors are betting that the inflation rate will continue to be compressed into a tighter and tighter long-term flag while the Government runs annual trillion-dollar deficits, the Federal Reserve continues with $120 billion a month in bond buying and quantitative easing, and the Treasury makes the printing press go Brrrrr forever;
 (Source: multpl.com)
Low Labor to Executive Compensation Rate
Investors are betting that the recent trend of lower and lower labor costs versus executive compensation will continue forever;
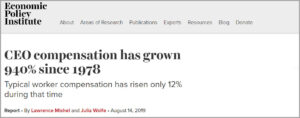 (Source: Economic Policy Institute)
High Corporate Profit Margins
Investor’s are betting that the recent trend of high corporate profit margins will continue forever;
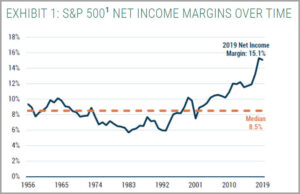 (Source: GMO)
Economies, businesses, and financial markets work in cycles. The underlying truth of cycles is that underlying conditions that may be part of the present do not last forever. We are in strange times indeed as a series of factors have aligned themselves and will come to an end at some point. One factor alone may be enough to bring the house of cards down.
The multiple forever factors that are driving detached valuations are interrelated. It only takes one of them to impact the next, which then would impact the next factor. Higher wages for employees would mean higher prices for final goods and services sold in the economy. That translates to higher inflation. Higher inflation on raw materials would also drive higher prices for final goods and services sold in the economy, forcing the labor force to demand higher wages. Higher inflation leads to higher interest rates. Higher interest rates lead to lower corporate profit margins because of the massive debt loads that have encumbered corporate balance sheets as firms raced to borrow at record low rates. Higher corporate taxes means lower corporate profit margins. Lower corporate profit margins would lead to lower earnings growth and should result in lower valuations. One drives the next forever factor, which causes the next forever factor to change. It’s doubtful we get one change and not any of the others.
Betting on these forever dynamics listed above isn’t a high probability bet.
Part II – Betting On Never
Proven principles of investing are not complicated. Longstanding examples would include buy low and sell high or buy quality investments at attractive prices. Principles like these seem so simple in theory. It’s common sense. But that doesn’t mean common sense leads to common practice. In financial markets, once emotions come into play, principles get thrown right out the window.
Investor Emotions Gone Crazy
Stock valuations have never been higher in over a century’s worth of historical data. In 2016 and 2017, the US equity markets began to show signs of irrational exuberance and detached reality. Over the past four years, the equity markets have continued to deviate into unchartered territory.
Below are the average of four well-known and valuable valuation indicators that covers over 120 years of market history. It should be noted that the appropriate time to be highly wary of financial markets is when valuations get into Zone 3. The fact that we may have to add a Zone 6 is a clear demonstration that there are no limits to human stupidity when people are chasing what they believe to be easy money. It’s a long-long way down to historical averages from here.
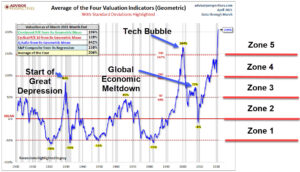 (Chart credit to Jill Mislinski of Doug Short/Advisor Perspectives)
One certainty to math and the law of averages for financial markets is that over long periods, overperformance turns into underperformance, and then the cycle starts over again.
Below is a chart of the S&P 500 going back to 1871 based on inflation-adjusted monthly averages where a long-term trendline could be generated using regression analysis. Publicly traded companies can only collectively grow earnings at a pace within the bounds of national and global economic growth. Over the long term, companies should appreciate in value as the economy expands and corporate earnings expand as well. But the prices of equities can’t outrun the economy or corporate profits indefinitely. Eventually, mathematical realities set in and act as gravity bringing things back into the mean and averages.
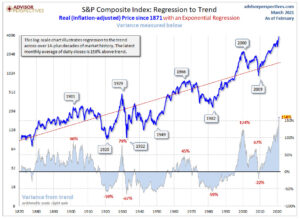 (Chart credit to Jill Mislinski of Doug Short/Advisor Perspectives)
Market Cap to GDP is a long-term valuation indicator that has been used and highlighted by Warren Buffett. Warren Buffett has described the market cap to GDP ratio as, “the best single measure of where valuations stand at any given moment.”
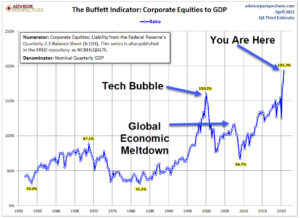 (Chart credit to Jill Mislinski of Doug Short/Advisor Perspectives)
Charlie Munger is the right-hand man and business partner of Warren Buffett at Berkshire Hathaway. Warren Buffett is one of the richest men on earth, and Charlie Munger is worth billions himself. Munger encourages others to invert situations when problem-solving. It’s a method to see things from a different perspective so that clarity could be obtained through the noise and chaos of decision-making.
If you were to ask many of the most successful portfolio managers what the ideal investment climate would be for investing over the next 10-12 years, here is a wish list of the most optimal factors;
- Begin with very low valuations in equity markets (allowing investors to buy low.)
- Begin with high dividend rates
- Begin with peak inflation with future rates falling.
- Begin with peak interest rates with future rates falling.
- Begin with high corporate and personal tax rates with future rates falling.
- Begin with high labor costs with future labor costs falling.
- Begin with low corporate profit margins with future margins expanding.
Sticking To Fundamentals and Principles
Unfortunately, most investors are incapable of sticking to fundamentals and principles consistently throughout their investment journey. Two powerful forces that usually lead to investors straying from proven investing success principles are emotions and a lack of historical references.
- Emotions directly impact investing behavior. Greed, fear, envy, crowd dynamics, social pressure to keep up, stress, regret, exuberance, or anxiety could all play roles in investor decision making.
- Historical references (or lack thereof) aren’t something that most investors actively seek out when making financial decisions. Financial history isn’t fascinating (to almost anybody on earth.) Most people are busy doing other things and don’t find pleasure in studying data, charts, or historical metrics. More than one person would probably say something like, “I’d rather poke my eyeballs out with a dull spoon than review decades worth of financial data.” Could you blame them?
But when you mix emotions with a lack of historical perspective, you can find plenty of examples of people making some nutty financial decisions that may very well impact the future direction of their household wealth.
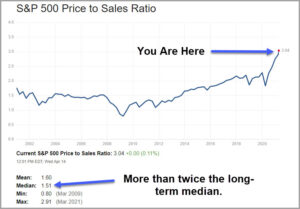
Publicly-traded businesses (stocks) have historically traded around 15 times earnings and 1.5 times sales revenue. But today, the average publicly traded stock in the S&P 500 is trading at almost 42 times the trailing twelve-month earnings and 3 times annual revenues.
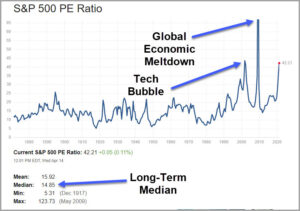
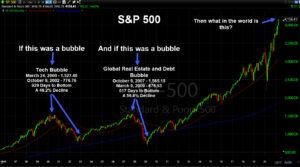
When we go back in modern financial history, we can find only four times where valuations deviated this far from corporate earnings and underlying fundamentals;
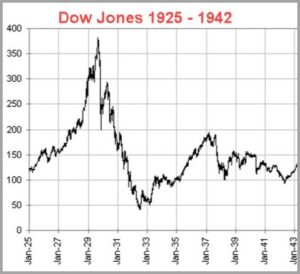
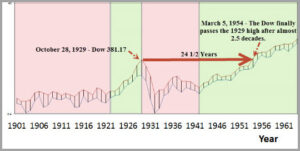
- US markets peak in 1929, right before the Great Depression. The result – From 1929 to 1932, stocks lost approximately 73% of their value (depending on indices measured.) It would take until November 23, 1954, for the Dow Jones Industrial Average to regain its high set on September 3, 1929. That’s over 24 ½ years for investors to get back to those previous highs. That doesn’t count the investors and companies that were entirely obliterated off the map and filed for bankruptcy. Investors should also take note that the bubble took multiple years to reach its ultimate peak before bursting eventually. During those years to the run-up to the peak, investors were convinced that the bull market would last forever and didn’t want to miss out on what they believed to be easy money.
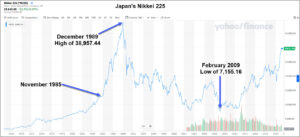
2. Japan markets peak in 1989. The result – From 1989 to 2009 (20 years to finally find bottom), stocks lost approximately 82% of their value over 20 years of finding new lows. Note that the euphoric bull market, when investors thought that the good times would last forever, ended up lasting for just over four years. It should also be noted that it’s been over thirty-two years since the peak insane market in Japan, and the index has still not regained its prior high.
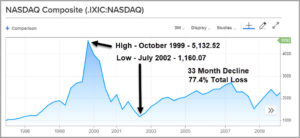
3. US Tech bubble peak in 2000. The result – From October 1999 to July 2002;
-
- The NASDAQ lost 77.4%
- The S&P 500 lost 50.5%
- The Dow Jones lost 38.75%
It would take the NASDAQ until January of 2015 to regain its prior high (over 15 years.)
- The US peak in 2007 before the Global Economic Meltdown. The result – From October 2007 to March 2009;
- The NASDAQ lost 55.8%
- The S&P 500 lost 57.7%
- The Dow Jones lost 54.4%
It would take the S&P 500 until October 2012 (five years) to regain its high.
The million dollar question to ask ourselves now is, “How many times have markets been in conditions like the present, and it worked out well for investors?” The answer is NEVER. There has never-ever been a single instance where markets didn’t revert back to their historical mean and significantly lower valuations. Nor has there ever been a time where corporate earnings grew into the lofty valuations to catch up.
Investors who have been piling into the markets over the past few years are literally betting on NEVER. Never just doesn’t seem like good odds. To each their own.
Part III – Betting On Someday
Investors are currently in love with what could be described as “someday” companies. Someday companies will change the world and be the next Amazon or Microsoft in the mind of bullish investors.
When investors place their bets on someday businesses, current business performance isn’t important. Current performance should be completely discarded, and in return, investors should only focus on what the company (might) achieve “someday.”
Zero revenue…no problem…Someday they will have huge revenues.
No operating cash flow…no problem…Someday the cash will be pouring in.
No earnings…no problem…Someday they are going to make it rain.
No dividends or distributions to owners…not to worry…Someday they are going to take all of that enormous profits and cash that they earn and just drop it off in dump trucks on the front lawn of those who jumped in early.
Make no mistake about it, there will be a company that will eventually become the next Amazon or the next Microsoft. There will be companies that change the world. The problem is that investors have placed their bets on hundreds (if not thousands) of stocks that they believe are going to become extremely profitable “someday.”
There is nothing wrong with investing in a company that has the potential to be a profitable enterprise. The problem is when you grossly overpay for that crapshoot. But when investors pay all at once and upfront for all the future profits that the enterprise will ever make, it’s virtually guaranteed that most of them will lose money (and a lot of money).
Just because a company may change the world, doesn’t mean you should pay any price upfront for it. You should only pay a price that correlates to the realistic future profits of that enterprise.
Imagine a scenario where a company already has a market value in excess of $1 billion dollars. But on top of that, imagine that the company doesn’t make a single penny of profits (I know…they will “someday.”) But on top of that, imagine that their price to sales ratio exceeds an extreme level such as 15 times sales.
If you ran a stock screen with those attributes;
- Market cap >$1 Billion
- Net income <$0 (currently losing money)
- Price-to-sales ratio >15
How many companies do you think would hit those metrics? The current answer is HUNDREDS. There are over 300 companies that showed up in my search when I tried to select the most ridiculous combination of investment metrics.
We described above that when we screen for very specific metrics that describe particular ridiculous valuation metrics, we discover hundreds of companies. But suppose we expand the search to encompass a wider range of slightly less insane valuation metrics on sectors such as SPACs, IPOs, technology companies, biotech, digital currency. In that case, there are thousands of companies that are currently trading at insane valuation levels. There is no way that all of them are going to be the next big thing.
The real winners in a market like this are those that started the company and then dumped the shares on investors in the public markets. The founders and entrepreneurs took advantage of investors willing to pay them (upfront) for all the future years of potential profits. The founders or entrepreneurs now have zero incentive to stick around and earn those profits over the next decade. Why should they? Someone paid them out (upfront) to take the cash guarantee.
One of the fundamental principles of successful investing is to buy quality companies at attractive prices. A quality company is a company that makes a profit and a growing profit, and a sustainable profit.
Companies that are unproven financially often aren’t an investment as much as it is speculation because the shareholder speculates on what they hope will happen “someday.” That someday may be next year or next decade, but it certainly isn’t next week.
Someday Example #1
What is an example of a someday company? The company SNAP, Inc. (Ticker: SNAP) could fit the definition. Snap, Inc. is a camera company. The company’s flagship product is Snapchat which people use to communicate through short videos and images.
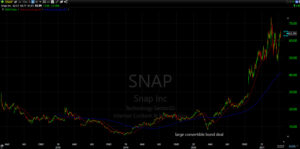
The company went public in the spring of 2017 at $24/share with the following
- A market capitalization of $36.192 Billion.
- In 2017 it ended the year with $825 million in revenues.
- It ended 2017 with a $3.486 Billion net operating loss.
- At the end of 2017, you couldn’t really assess a true Price/Earnings multiple because earnings were NEGATIVE.
- Price/Sales multiple was 43.87.
Fast forward to today;
- A market capitalization of $97.135 Billion
- In 2020, it ended the year with $2.507 Billion in revenues.
- It ended 2020 with an $862 million net operating loss (2018 and 2019 had losses in excess of $1.1 Billion each year).
- At the end of 2020, you couldn’t assess a true Price/Earnings multiple because the company still doesn’t make a dime of profit (negative earnings.)
- Price/Sales multiple was 38.75.
Investors continue to believe in someday for SNAP. Someday they will earn a profit. Someday they may return some of that profit to shareholders. But also remember that someday the company will no longer be able to grow revenues at the same rate. Someday they will also be a mature company.
The question is, what happens if SNAP grew into its current Price/Sales multiple of 38.75 where the Price/Sales ended up at the long-term mean Price/Sales of every other company over history, which is around 1.5? At a market capitalization of $97.135 Billion already built-in, it would imply that revenues will need to grow to $64.757 Billion to satisfy the current valuation at some point in the company’s future. And as we stated above, over the past four years, SNAP was able to grow their revenues up from $800 million to $2.5 Billion. That’s a long way away from $64.76 Billion of annual revenues.
That’s a lot of freaking phone pictures… For reference, American Express, the Dow Jones Industrial Average financial services company, has approximately $40 Billion in revenues each of the past four years. It’s somewhat likely that someday, investors will wake up and realize that the earnings potential of a business like SNAP is far less than what they dreamed about.
Someday Example #2
Here’s another random example of a someday company for the cool kids at the back of the bus. How about a company called Zymeworks (Ticker: ZYME) which trades on the New York Stock Exchange.
- Zymeworks has a market capitalization of $1.395 Billion
- Revenues
- 2017 – $51.762 million
- 2018 – $53.019 million
- 2019 – $29.544 million
- 2020 – $38.951
- So basically falling revenues
- Operating Income
- 2017 – $8.537 million loss
- 2018 – $33.359 million loss
- 2019 – $150.643 million loss
- 2020 – $189.974 million loss
- Do you see a trend here? Falling revenues and growing losses
- BUT WAIT…THERE’S MORE! Total Liabilities (which are helping to fund the losses.)
- 2017 – $15.460 million
- 2018 – $63.789 million
- 2019 – $121.306 million
- 2020 – $126.731 million
Zymeworks was in my filter for someday companies worth over $1 Billion, with zero earnings, and Price/Sales ratios that exceed 15. There are HUNDREDS of companies like Zymeworks out there.
Again, expanding our search beyond the super extreme like Zymeworks and we still come up with THOUSANDS of companies with unimpressive business operating results but are trading at insane valuations.
But current investors don’t seem to be worrying. They are opening up brokerage accounts at record pace and depositing their stimmy checks and savings as they wait around for someday.
It’s important to remember that investors have been making the same investing mistakes for hundreds of years (maybe thousands.) The individuals change, but the dynamics of greed and fear don’t. In the real world, things are constantly changing. The dynamics change, and we individually get hit with events that we never see coming.
Here’s the tragedy in all of this. There is no common sense in the financial markets at the moment (not that something like this has never happened before.) Millions and millions of American’s, many of whom are first-time investors, have opened up brokerage accounts since early 2020 when they received their stimulus checks (and had a gambling itch to scratch.)
If you back up and think about it, when is the VERY BEST TIME to be an investor? Aren’t we supposed to buy low and sell high? Aren’t values low when markets have come off a long stretch of underperformance? And what have stock markets done since 2016? The values have gone insane. The result is that millions and millions of brand new and inexperienced investors are investing at the exact opposite of when it is optimal.
The likely result will be substantial investment losses for investors piling into the markets right now. Investors, yet again, bought high to then be forced to sell low. What will these newbie investors do when they wake up and realize that Wall Street once again picked their pockets? Will there be a protest? Will there be anger? Will there be rage? Probably, but how is this any different than the previous times that greed and ignorance have run through financial markets?
Many investors believe that since markets continue to rise, this isn’t a bubble and that the markets have been a great bet for their capital. That’s not how this works. That’s never how this works in bubbles.
When you buy a share of stock, you are buying a share in a company. That share entitles you to the future results of the underlying business. You are buying a share of the future earnings and cash flows. The higher the price you pay for those future earnings, the lower your long-term return will be. Simply put, if you over-pay for any investment, you are eating into your future returns.
Investors today aren’t making this connection. Rather, they believe since stocks are going up, they will continue to go up and that the underlying fundamentals don’t matter.
Further, since bubbles can last for multiple years, that lulls investors to forget about fundamentals like earnings, cash flows, and dividends. If investors did step back and did some simple back of the napkin calculations, they wouldn’t be so willing to part ways with their stimmy checks or hard-earned savings.
It’s very difficult to keep your wits during a runaway bull market. It’s very difficult not to let your emotions take over. It’s very difficult to keep greed checked to a minimum. It’s very difficult not to be envious of your neighbor who is bragging about easy money made in the markets.
But at the end of the day, most investors will keep repeating the same results of prior cycles. That was true in the past, it’s true today, and it will be true in the future. If the masses and general population knew how to invest and become wealthy, everybody would be a multi-millionaire. But that isn’t how it works.
Humans will be human.
One Final Example
I’m going to wrap things up with one final example that may combine forever, never, and someday in one shot to show how the current market has distorted into a magnified clown show.
Hometown International, Inc. (Ticker: HWIN)
Below is a picture of the main asset of Hometown International, Inc.

It’s a single New Jersey deli doing $35,000 in sales and is valued at $100 million in the stock market. The deli was even closed between March 23, 2020, and September 8, 2020, because of the pandemic. During that time, the stock increased in value from $3.25/share to $9.25/share and is currently trading at $13.50/share.
The company also booked expenses of $154,000 in 2019 and over $600,000 expenses in 2020. This example was highlighted in hedge fund manager David Einhorn’s investment letter and later covered by CNBC here.