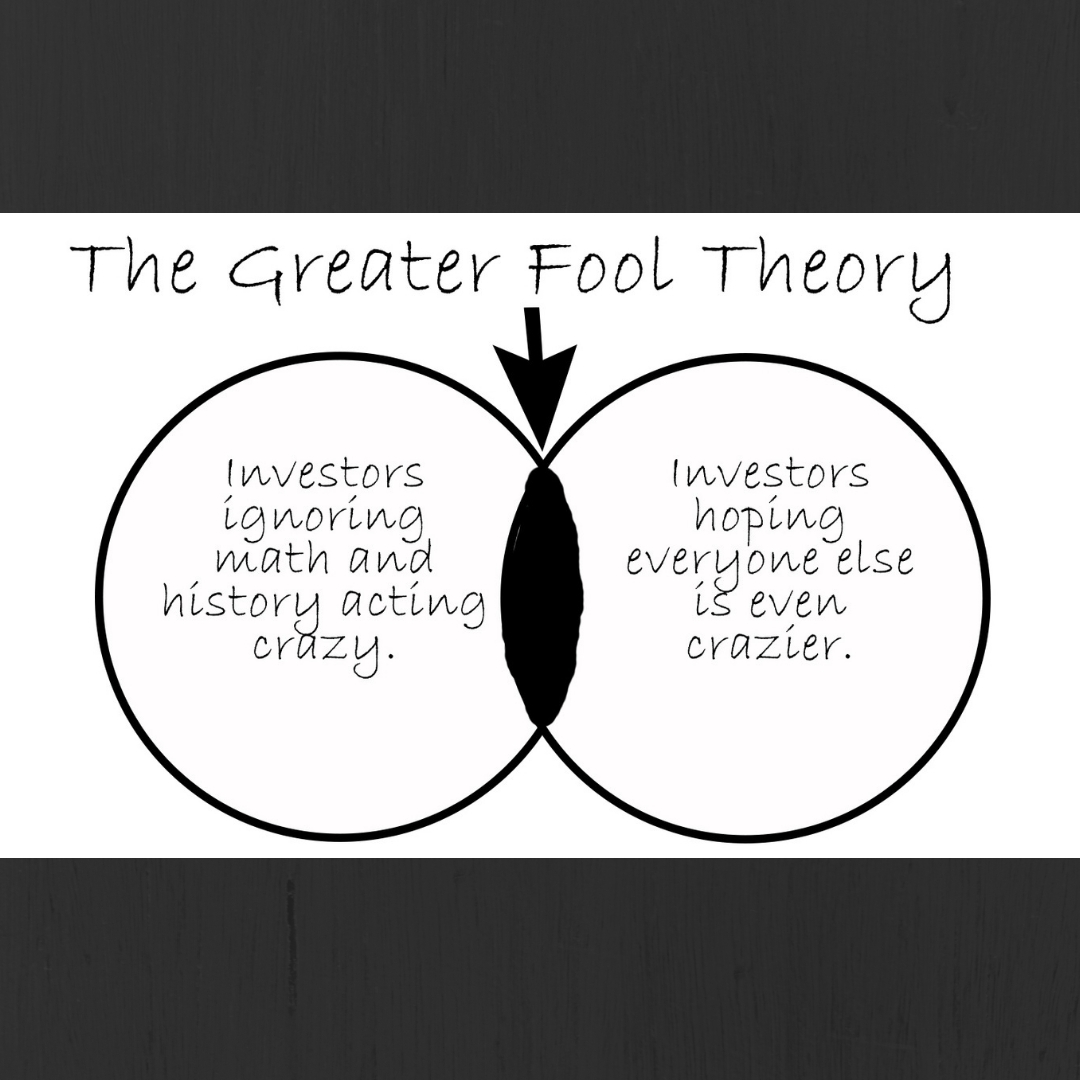
“The Greater Fool Theory states that the price of an object is determined not by its intrinsic value but rather by irrational beliefs and expectations of market participants. A price can be justified by a rational buyer under the belief that another buyer is willing to pay an even higher price.” – Wikipedia
I have had several clients ask me, “How high can bubbles possibly get?” My response is, “There are no limits when bubbles persist. Some bubbles also grow bigger than others or last longer than others. But bubbles will always be a part of financial markets because of core human behaviors and the dream of acquiring fast money. Cycles are just part of life.”
Market valuations are at record high levels by many historically accurate metrics. Keep in mind that market valuations and stock prices can be two totally different animals. If you think about it, we want and desire higher stock prices over the long-term. Market prices that reach new highs is actually a great thing and that is the entire purpose of investing for your future. We want higher stock prices now and into the future over the long-term.
The difference is that we want stock prices to be “rational” and congruent based upon other reliable factors such as the size of the economy, underlying corporate profits, and debt levels. When prices diverge away from underlying fundamentals, it creates risk for investors because the prices have deviated from what investors really want which is their rightful share of corporate profits and future earnings.
If you study history and past bubbles, you see common characteristics in each bubble. You see irrational behavior amongst investors. You often see the governments and central bankers pumping and stimulating the economy and manipulating interest rates and monetary policy. You see the proliferation of debt. Finally, you see prices move far faster than the growth of the economy and the underlying growth of corporate profits.
The results of these factors create an investing environment whereby the price you pay for the underlying investment is far too high relative to the underlying asset that you invested in. In these cases, the potential for upside gains and returns just aren’t worth taking the required risk with your hard-earned capital.
Investors are also subjected to mental, emotional and behavioral liabilities. These come out as behavioral biases in their decision making. One such example is what is called, “Recency bias.” Recency bias is where a person believes that whatever is happening right now (good or bad) will continue in perpetuity. They assume nothing will ever change. But that never happens in the real world. The real world is always about cycles and change. Everything eventually changes.
We’ve gone through booms and busts. We’ve gone through war and peace. We’ve gone through high interest rates and negative interest rates. We’ve gone through entire industries such as horseback transportation, fax machines, and film photography. The only actual constant in life is change itself.
As investors believe that everything is awesome in global financial markets, they seem to ignore what is right in front of their eyes; record breaking global debt levels, rising interest rates, tightening central bank policies, and finally, never seen before record high valuations on most financial assets.
A few things are clear from history. First, is that bubbles are part of the system. This should be recognized because by the very nature of bubbles, they require that the masses believe that no bubble exists and that everything will continue to be exuberant. We saw this in bubbles of the past whether that was the stock bubble in the late 1920’s, the Japanese stock bubble of the late 1980’s, the tech bubble of 1999/2000, or the housing bubble of the mid 2000’s. All these bubbles had one important common denominator and that was the fact that nobody wanted to believe that they were participating in a bubble.
Another component of bubbles is that most people are unprepared for when the bubble bursts and the next phase of the cycle begins. They may have overextended themselves financially, built up debt, lack emergency funds, assumed that they had permanent and secure employment, and usually have themselves invested in assets that are subjected to large and fast declines when the bubble burst.
For now, I highly recommend that investors and wealth builders get prepared and be ready for what surely is to come, sooner rather than later, and that is the second half of the longer-term cycle. That includes falling valuations, an eventual economic recession, rising interest rates, and plenty of upcoming debt problems. If you still have debt on the books, now is the time to get that to extremely manageable levels (or eliminated completely.)
Now is the time to build cash and be ready for the second half of the cycle. We don’t know when the cycle will finally peak, we only know that valuations are at extremes and debt levels are at extremes. These factors are never permanent. It’s best to be ready.
Tidbits of Goodness
Healthcare
I can only stress to you after working with wealth builders over the past few decades the importance of health as it integrates into a well-designed wealth plan. More specifically and to the point, if you don’t have your health, you don’t have anything. If you have been putting off a health checkup, a fitness program, bloodwork, or a healthier diet, the best time to get started is yesterday. The next best time is right now.

Fall Planning and Maintenance Items
It’s already October which means Halloween is right around the corner. Once Halloween is here, you know the drill, it’s the holidays with Thanksgiving, Hanukah/Christmas, and then New Year’s. The time flies during this part of the year and the fourth quarter. Don’t wait until the busy holiday season to address things that you could knock out over the next few weeks as part of your annual planning. These would include items such as;
• Reviewing the beneficiaries on any qualified accounts (401k’s, IRA’s) or life insurance.
• Reviewing your insurance coverage as you head into 2019 which would include life, disability, health, home, auto, and umbrella policies.
• Updating or completing estate planning documents if yours are inappropriate or out of date. This would include wills, living wills, and powers of attorney/healthcare power of attorney.
• Start thinking about 2019 financial goals such as income, debt, emergency funds, or annual budgets.
That concludes the normal update. My full market valuation report for the hardcore and analytical folks starts below in the next section.
If you should have any questions or need to talk, please feel free to contact me. I am here for you.
Very kind regards,
Paul

Get valuable tips and insights on debt free and healthy living at the blog – https://paulkindzia.com/blog/
Follow me on Facebook at – https://www.facebook.com/paulkindzia/
Instagram at – @paulkindzia
Twitter at – @paulkindzia
For You Finance Geeks Like Myself – Behold – My Full Market Valuation Report Through September 2018 Is Below
A Look Back Over 20 Years
“For those wise investors who pay attention to historical norms, we know that 1996 through 2000 was a valuation bubble, and we know that 2003 through 2007 was a debt bubble. Current valuations and debt levels are above those past recent examples. What should a rational investor think about today’s situation with a double-whammy in play?”
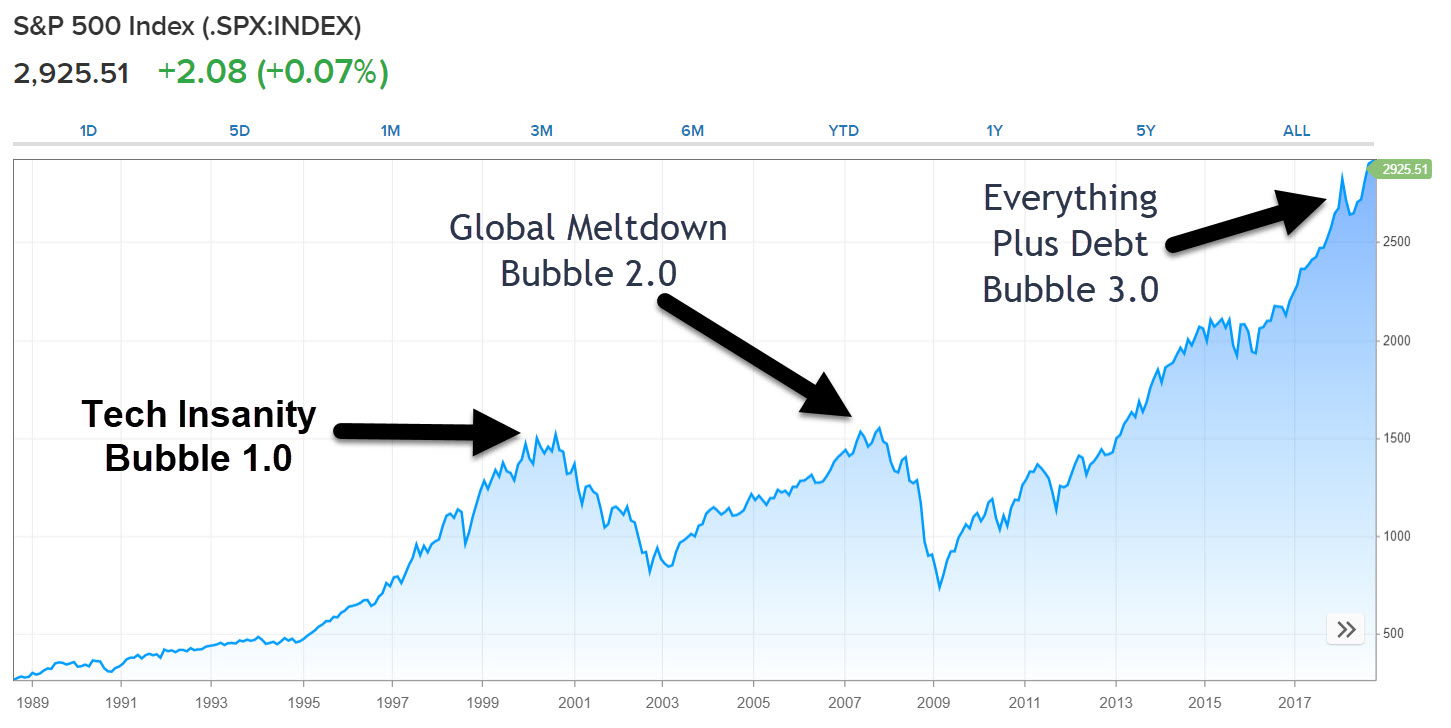
Just as a friendly public service announcement, the tech bubble led to tech stocks dropping 82% while the S&P 500 dropped over 50%. The global economic meltdown resulted in the S&P 500 dropping 57% over about 18 months while many individual stocks posted losses far greater than that. How do you really think this current bubble is going to end other than painfully just like bubbles of the past?
If you study market history and averages, then it would be important to know that the markets would have to come down about 65% just to get back to long term average valuations. Note that by the very nature of math, markets are both above average and below average for stretches of time to get to “the average.” Thus, it wouldn’t be out of the ordinary for markets to end up “below average” at some point for a stretch of time to reset back to the mathematical average. That’s just something to consider.
And if you are sitting there thinking, “There’s no way markets can come down greater than 50%!” then you are historically challenged because markets have come down more than 50% every single time they have been at extreme levels of valuation like today (1929, 1999, 2007 and throw in Japan in 1989). We are living through a lifetime event right now whether you realize that or not.
If you are thinking, “Yeah but stocks ALWAYS come back quickly,” then you are historically challenged. It took almost 25 years for the Dow to just get back to break-even after the 1929 market collapse when valuations were less extreme than they are today. The Dow Jones peaked on October 28, 1929 at 381.17 and did not hit that level again until March 5, 1954. Investors spent 24 ½ years just trying to get back to “Even-Steven.”
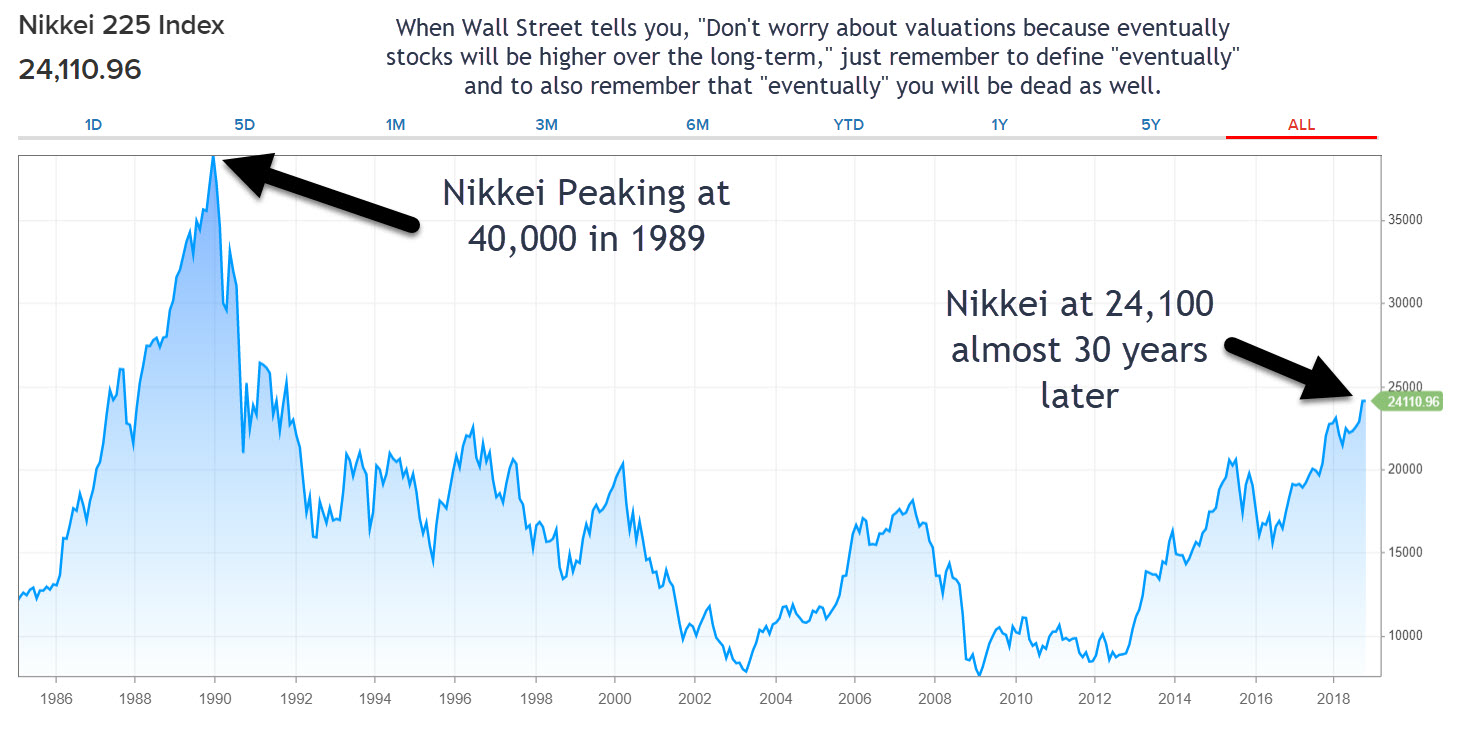
To add, Japan had an epic bubble that peaked in 1989 when the Nikkei hit 40,000. It’s almost 30 years later and the index has finally recovered to 50% of those levels last seen three decades prior. So, if you are saying, “Stocks always come back no matter how insane the valuations,” you are historically challenged.
On Debt
Global debt is now appearing to be a runaway train. It’s a $247 trillion global debt bomb. In a desperate attempt to re-stimulate the global economy after the last meltdown/bubble (ironically caused by debt), central bankers lowered interest rates to never seen before low levels (including negative rates in many parts of the world.)
The result was a decade long debt binge as borrowers treated these low interest rate loans as free money. But now interest rates are rising and many of the loans need to be rolled over or re-financed. These borrowers will be required to pay higher interest rates on debt that has already been borrowed and spent.
Global debt increased from 248 percent of GDP in 2003 to 318 percent of GDP in 2018. In the first quarter of 2018 alone, global debt rose by a massive $8 trillion which includes consumer debt, business, and government debt. It’s all fun and games until your loan comes due and you can’t pay it back or the cost to roll it over into a new loan becomes vastly more expensive because interest rates rose. The debt party will soon be coming to an end and it is important that it is not you who wakes up from a massive hangover.
Even here domestically in the United States, consumer debt levels are reaching unthinkable levels. Student loan debt is now $1.53 trillion. Auto loan debt is now $1.13 trillion and credit card debt is $1.03 trillion. Throw in mortgage debt and it’s easy to understand why everybody is complaining about being cash strapped. More and more of each household’s disposable income is being allocated towards making debt payments.
It appears that as income couldn’t keep up with spending, borrowing replaced that income gap. One thing is crystal clear, your American neighbors are completely loaded up to their eyeballs in debt. You may think that your neighbors, friends and co-workers are financially successful and living the dream, but behind the scenes they most likely are on track for a debt nightmare.
Going Three Layers Deep On Valuations
As we recall the lessons of our past, we must acknowledge that cycles and bubbles are part of markets. Markets are made up of humans and humans are irrational beings driven by greed and fear. Markets won’t change because humans won’t change. They are what they are.
Valuations One Layer Deep – A Look At Basic Valuation Metrics
Valuation Metric #1 – Shiller P/E (also known as CAPE ratio which accounts for the normal impacts of business cycles.) Conclusion – Extreme valuations surpassing those just prior to the Great Depression.
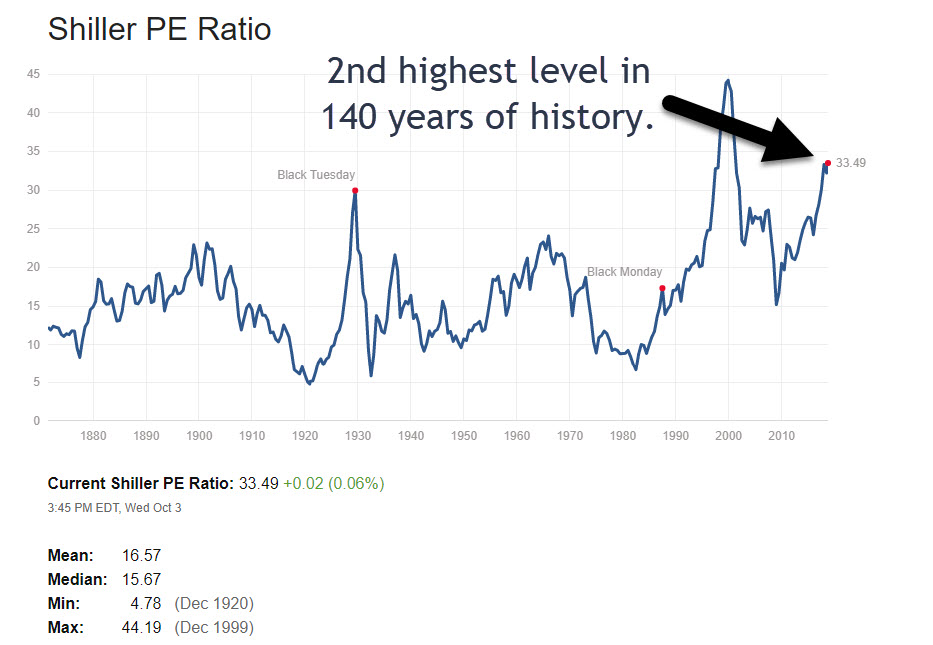 Source: Multpl.com
Valuation Metric #2 – Price to Sales Ratio of the Median Stock in the S&P 500. Conclusion – Extreme valuations that have significantly surpassed all-time highs. Investors are paying ever higher levels in stock prices for every dollar of revenue generated by corporations.
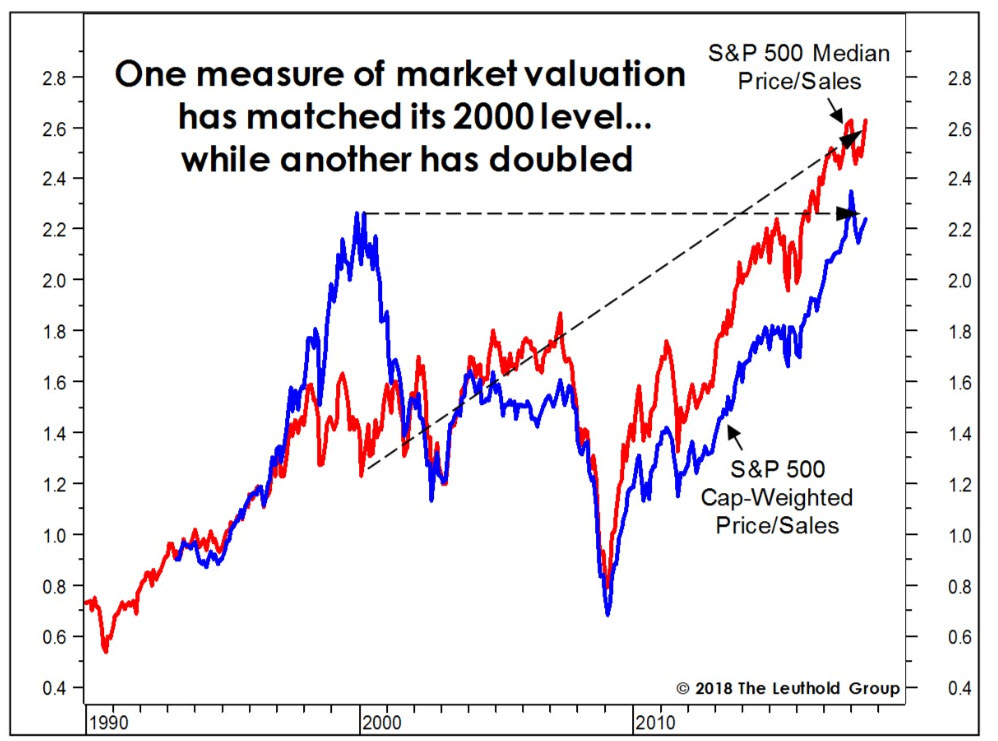 Source: Leuthold Group (Awesome work Leuthold Group!)
Valuations Two Layers Deep – We now look at some more sophisticated valuation metrics that provide insight into current market conditions.
Valuation Metric #3 – Buffett Indicator, Corporate Equities Market Capitalization to GDP. This metric compares stock prices to the level of GDP (the underlying economy). Conclusion – Extreme valuations that have only been higher just before the crash of the tech bubble.
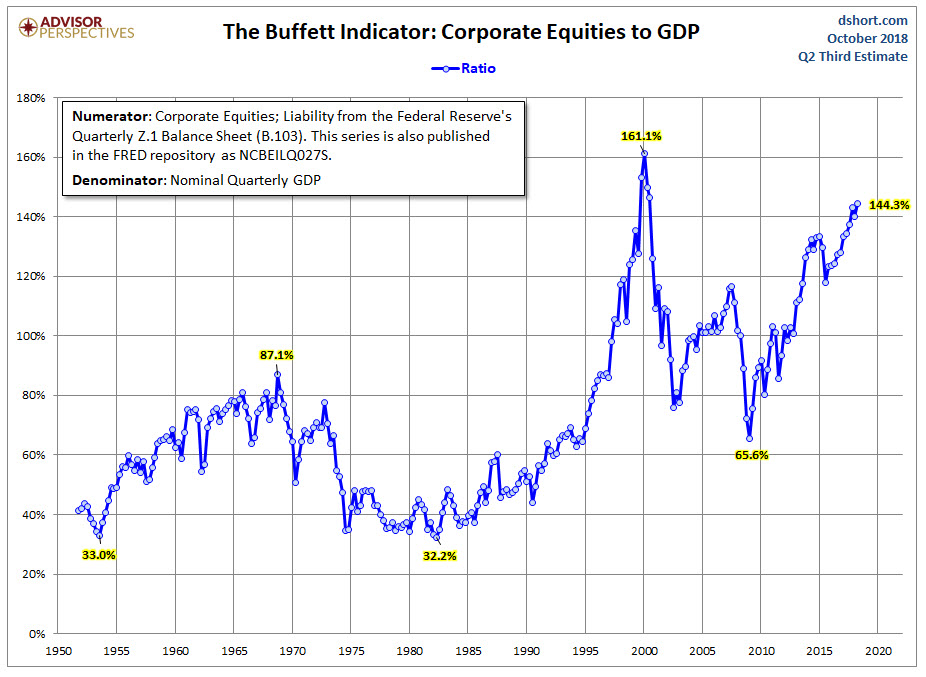 Source: Doug Short and Advisor Perspectives
Valuation Metric #4 – Q Ratio. The Q Ratio was developed by Nobel Laureate James Tobin. It is the total price of the market divided by the replacement cost of all its companies. Conclusion – Extreme valuations that have only been higher just before the crash of the tech bubble.
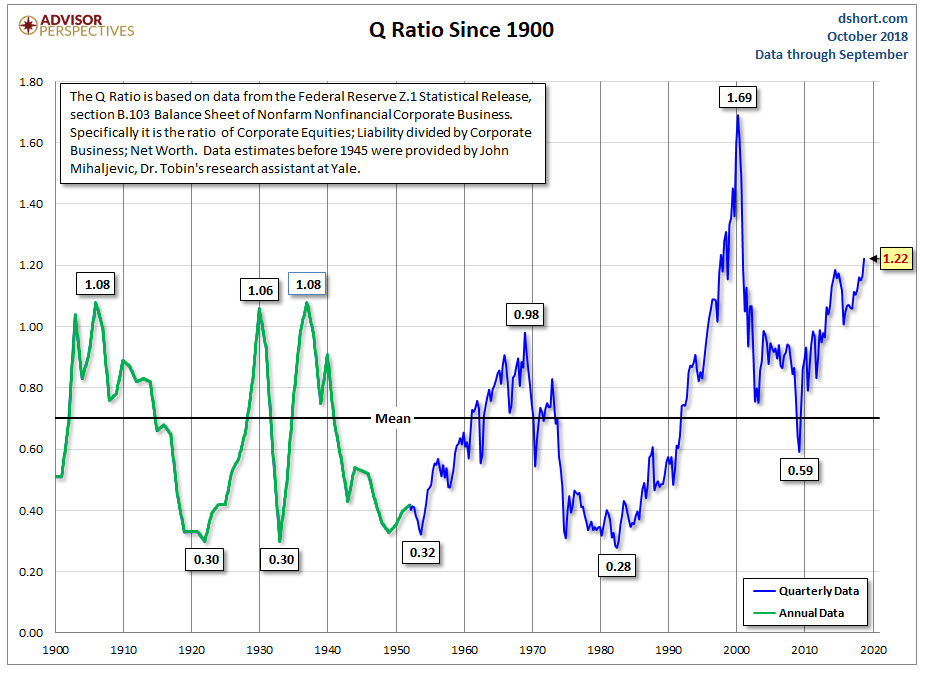 Source: Doug Short and Advisor Perspectives
Valuations Three Layers Deep – We now look at some of the most sophisticated valuation metrics that provide insight into current market conditions.
Valuation Metric #5 – S&P Regression To Trend. The idea here is that things revert back to the mean especially in the stock market and over the long-term, over-performance turns into under-performance and visa-versa. Conclusion – Extreme valuations that have only been higher just before the crash of the tech bubble and significantly higher than levels before the Great Depression and prior to the Global Economic Collapse of 2008-2009.
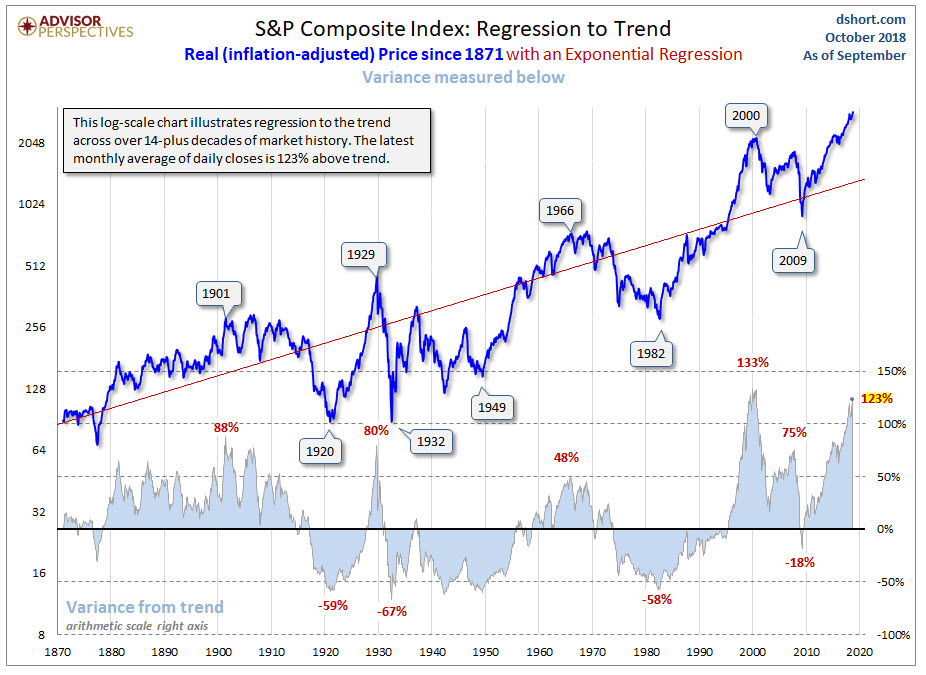 Source: Doug Short and Advisor Perspectives
Valuation Metric #6 – Margin-Adjusted CAPE. The idea here is that you can adjust for the longer-term cyclical profit margins in corporate equities and assume that they will return to the mean and then based on current valuations you can predict what 12-year average returns will be for those same equities. This model has proven to be quite resilient and accurate in predicting longer-term returns.
Conclusion – Investors buying equities at these current levels should expect a 12-year annualized rate of return that will be negative (with large negatives along the way as prices revert to the mean between now and then). Thus, investors who are paying current prices are only subjecting themselves to extreme levels of risk with the high probability of losses until prices come down to more reasonable and profitable levels.
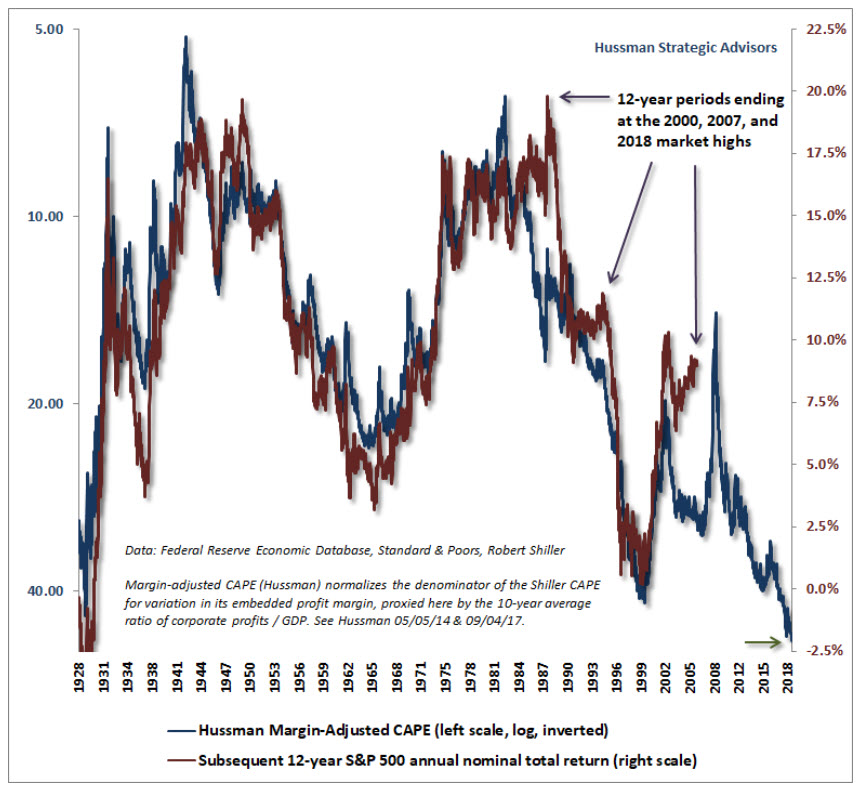 Source: Hussman Strategic Advisors
Valuation Metric #7 – Geometric Average of the Four Valuation Indicators. Using averages of four but different methods of valuation metrics can provide investors with an overview to ensure that they aren’t just paying attention to one single outlier metric that may not accurately reflect current valuations. Conclusion – Full on bonkers. Buyer beware.
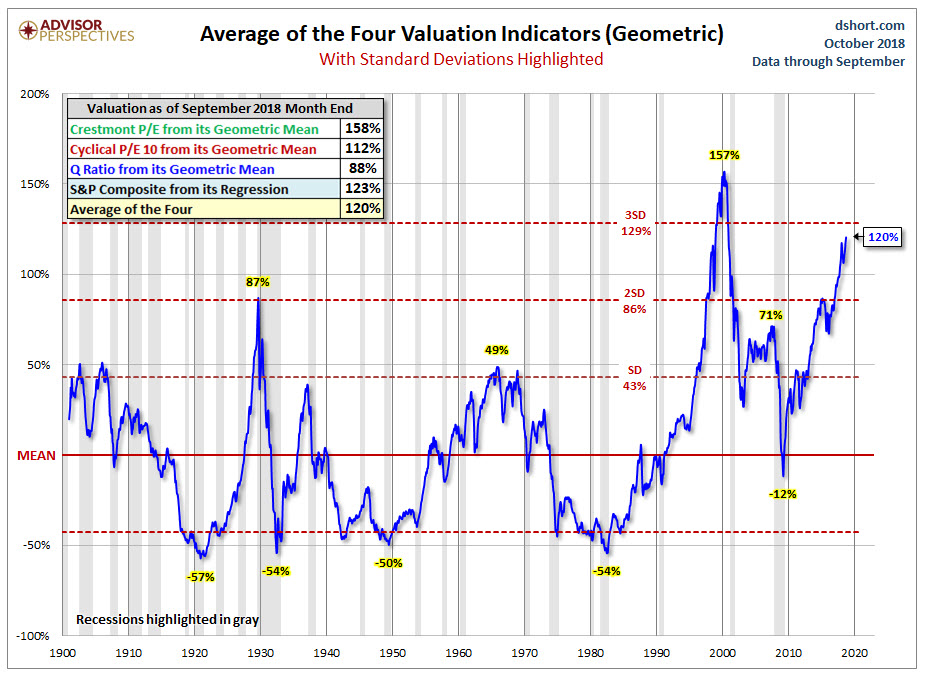 Source: Doug Short and Advisor Perspectives
Corporate Earnings Shenanigans
We have one last item to be very skeptical of coming from Wall Street. Wall Street loves to tout the growth of earnings as a reason for the ever-increasing levels of stock prices. They have very good reason to do that as they want to keep investors in the game paying higher and higher prices for their offerings so that they can continue to collect their fees and commissions.
But most investors don’t know that corporations report two different sets of books and numbers. The first set of books (and most highlighted and publicized by the media and Wall Street) is what is called “operating earnings.”
Operating earnings is what Wall Street wants us to focus on. It is the level of earnings that corporations make from what they describe as the “normal course of business.” But something isn’t right in fantasy-land. If we look at the chart below, we can see that the growth in operating earnings since 2011 has been up 63.2% yet stock prices have gone up almost 2 times those levels. Should you be skeptical? Yes, you should be. Stock prices can’t deviate from earnings indefinitely. Eventually they must reconcile and correlate.
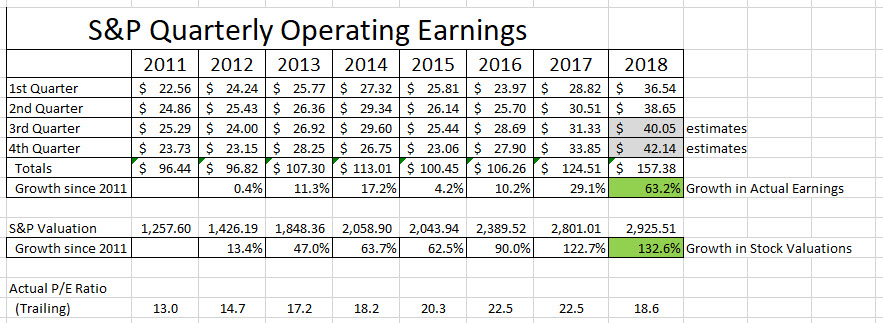 Source: Standard & Poors and Paul Kindzia
What this is indicating is that investors have been paying higher and higher levels for the underlying stocks and earnings.
The Second Set Of Books
What most investors don’t realize is that these same publicly traded companies must report earnings to the SEC based on Generally Accepted Accounting Principles that are audited by CPA firms. This second set of books produces what is called, “As Reported Earnings.”
What’s the difference between the two sets of numbers? There is a big difference. With the first set of books, corporations can report earnings from what they consider, “The normal course of business.” That means what they would expect their business to produce in normal and consistent ways. This allows them to ignore actual expenditures, costs and expenses related to what corporations would describe as “One-time events” or “Unusual Items.”
This is where the magic of fictional accounting enters the scene. I want you to imagine that a corporation acquires another organization to boost their earnings per share. If the acquisition turns out to be a big flop and lost money, corporations can write-off the losses and ignore those losses in “operating earnings” and claim it as a “one-time unusual event.” Voila! The losses are excluded from operating earnings which are used by Wall Street to promote stocks to investors who don’t know any better.
There are all kinds of examples of how corporations exclude real losses from operating earnings by doing accounting tricks. But SEC rules mandate that all publicly traded companies also report, “As Reported Earnings.” Consider these earnings to be “the real deal earnings” without all the tricks, smoke, and mirrors.
As reported earnings have to include all of the corporate blunders and true costs of operating the business. Below are the “As Reported” earnings over the same 2011 – 2018 time period.
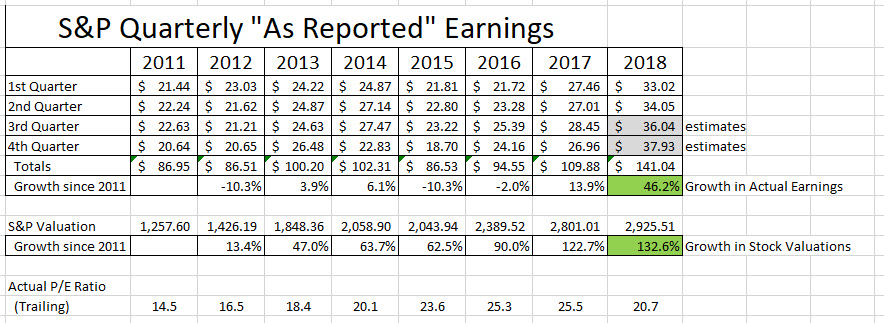 Source: Standard & Poors and Paul Kindzia
Now the discrepancy is even larger. We have actual “As Reported” earnings that have only grown 46.2% over the past seven years yet the prices of stocks have gone up 132.6%. Buyer beware. Investors are being fooled and being sucked into the bubble due to greed and the dream of easy money.
Conclusion: Markets have been and continue to be at extreme levels of valuations that based on past history will end very badly for investors buying at these price levels.
Add in the additional factors that are distorting the books of companies such as borrowing money to buy back shares (decreasing the float), tax inversions, re-financing debt or issuing large amounts of debt that must be dealt with down the road and you have a recipe for a day of reckoning.
How To Make Money and Build Wealth In Financial Bubbles Safely
Building wealth requires one to see the similarities from financial history and what happens when you get into valuation bubbles and debt bubbles. This allows you to avoid those eventual losses on the back end of the cycle.
Building wealth during bubbles means keeping your personal debt levels low or better yet – getting your household debt free. Avoid the financial imprisonment that millions of others are experiencing, often with life sentences.
Building wealth means doing very basic things; making a strong income from personal productivity, living below your means, building emergency funds, paying off debt, and avoiding bad investment risks by investing wisely FOR THE LONG TERM.
The rewards will be had on the other side of the mountain when prices reset and the debt bubble collapses.
“The one thing we really learn from history is that humans are known to completely ignore history.”
The Dangers of Buying And Holding During High Valuations
If you are an investor who is buying or holding large amounts of equities during times of extreme market valuations, you are basically saying that price does not matter at all in investing. But what you should know is that eventually PRICE ALWAYS MATTERS.
Now a comment that is made very often by investors is, “But if I am too conservative for a period of time during market extremes and generate a low return, I can’t/won’t meet my goals. Plus, everybody else is making easy money while I’m missing out.” But this mindset is assuming that markets will stay at extreme valuations forever and ever.
The question you need to ask yourself is this; “If you don’t think you will reach your goals while temporarily earning a low rate of return to protect yourself during market extremes, how do you really believe you will reach your long-term goals if you watch your capital base diminish 40%, 50%, 60% or more?”
We have only been in extreme conditions like this a handful of times in market history and they all ended terribly with very large investor losses for those taking on that investment risk. Ask yourself what would happen to your retirement plans if you lost 50% or even more than 70% of your capital base?
Could you hang on and recover from such a loss?
The value of having a trusted advisor on your side is that they can help guide you during these times. We are here to help you navigate what should be very challenging market conditions during the second half of the market cycle.
And here is the good news…For those wise investors who pay attention to price and value and protect their capital during bouts of extreme valuations, they are best positioned to take advantage of lower prices and better values once market conditions reset to historical norms.
The key to successful investing is to buy quality investments at fair prices (or better yet – attractive prices.) If the price isn’t right, you should have the fortitude, discipline, and patience to simply not buy and wait for better prices to come along in the future.
What would it feel like to boost your wealth significantly over the coming decade? Avoiding high risk investment conditions is one of the best tactics and strategies available to make that happen.
If you should have any questions or need to talk, please feel free to contact me. I am here for you.
Very kind regards,
Paul
Get valuable tips and insights on debt free and healthy living at the blog – https://paulkindzia.com/blog/
Follow me on Facebook at – https://www.facebook.com/paulkindzia/
Instagram at – @paulkindzia
Twitter at – @paulkindzia